Operations | Monitoring | ITSM | DevOps | Cloud

Latest News

Getting Started: Writing Data to InfluxDB

This is a beginner’s tutorial for how to write static data in batches to InfluxDB 2.0 using these three methods. Before beginning, make sure you’ve either installed InfluxDB OSS or have registered for a free InfluxDB Cloud account. Registering for an InfluxDB Cloud account is the fastest way to get started using InfluxDB.

Getting Started: Streaming Data into InfluxDB

This is Part Two of Getting Started Tutorials for InfluxDB v2. If you’re new to InfluxDB v2, I recommend first learning about different methods for writing static data in batches to InfluxDB v2 in Part One of this Getting Started series. This is a beginner’s tutorial for how and when to write real-time data to InfluxDB v2. The repo for this tutorial is here. For this tutorial, I used Alpha Vantage’s free “Digital & Crypto Currencies Realtime” API to get the data.

How to "Translate" Grafana Dashboards from Prometheus to Elasticsearch

In the field of open-source metrics and time series monitoring, it is quite clear today that Grafana is the most popular tool of choice. One of Grafana’s main advantages is its storage backend flexibility. It can support almost all the major time series datastores (Prometheus, InfluxDB, Elasticsearch, Graphite etc.), when each datastore has its own query language syntax, and slight differences in the actual Grafana UI and capabilities resulting from these differences.

Get a live view of network performance with OpManager's Real-time Dashboard

Although network monitoring is an unenviable task, it must be done to sustain your network’s health. But what if you had a real-time report containing only key metrics, revealing how your network is doing without overloading you with information? This would (1) assure you that there are no aberrations in your network and (2) give you peace of mind.

Monitoring Apache Web Server with Bleemeo

The Apache HTTP server commonly known as Apache was officially released in 1995. Nowadays is one of the most popular HTTP servers on the World Wide Web. Many organizations such as Facebook, Cisco, IBM, and of course Apache Software foundation itself uses it. It's an open source web server, maintained by Apache Software Foundation. Apache is a cross-platform, even if the vast majority of server instances runs on Linux but some version also run on Windows.

Jaeger Essentials: Best Practices for Deploying Jaeger on Kubernetes in Production

Logs, metrics and traces are the three pillars of the Observability world. The distributed tracing world, in particular, has seen a lot of innovation in recent months, with OpenTelemetry standardization and with Jaeger open source project graduating from the CNCF incubation. According to the recent DevOps Pulse report, Jaeger is used by over 30% of those practicing distributed tracing.

Node.js Logging: A How-to Guide

When visiting a new website, it is quite normal to get carried away by the bells and whistles of the fancy UI and UX and not be able to appreciate all the lower level, back-end code that runs tirelessly to ensure a smooth and fast website experience. This is because your front-end HTML code has a visually rich browser page interface as a platform to showcase its output. Whereas your back-end, server-side code usually only has a console at its disposal.

Website Benchmarking: An Example on How to Benchmark Performance Against Competitors

Time to first byte, first contentful paint, DNS response time, round-trip time, and the list goes on and on. With all of these metrics, how are you supposed to know which are the most important ones that you should monitor? To understand what those numbers are supposed to look like, you’ll have to get a reference point. Something that’s supposed to give you a starting point.

Papertrail Alerts

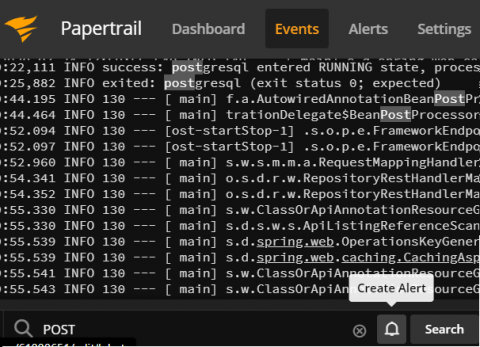
In a perfect world, how would like to learn about a problem? If you’re like the development team here at SolarWinds® Papertrail™, none of these options sound good. We’d all prefer to be notified when something starts to fail, but before there’s a service impact. At a minimum, we want to know the instant a service or application goes down. Fortunately, Papertrail has some powerful and easy-to-use alerting capabilities.