Operations | Monitoring | ITSM | DevOps | Cloud

Latest News

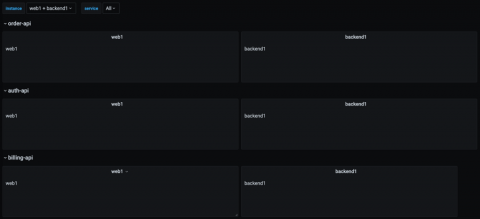
Learn Grafana: How to automatically repeat rows and panels in dynamic dashboards

Running your software on dynamic infrastructure means that your monitoring platform needs to change dynamically. Variables let you reuse a single dashboard for all your services. Select the service you want to inspect from a drop-down menu, and watch panels update to only show you metrics from that service. Grafana lets you create dynamic dashboards using template variables. Any variables in your queries interpolate the current value of the variable before the query is sent to the database.

Purposeful Power Monitoring for IT

Have you ever lost power to a server? Did it ever reboot on its own? Wouldn’t it be nice to prevent power outage to IT devices? If this is something you’ve experienced in the past, there are ways to simplify power monitoring and avoid some of the outages that can be caused by power issues. This article will focus on using power consumption data from a rack power distribution unit (rPDU) and how to simplify the process.

The Ultimate Guide to Serverless Monitoring Platforms

Technology touches almost every corner of the world economy. Even when it’s an indirect relation, in many cases tech is an essential, vital part of our societies. It just can’t fail without causing too much distress and losses. Not only financially, but especially to the human aspect.

10 Computer Networking Books Every Network Manager Should Read

Let’s be honest: As a network manager, you’re responsible for knowing a little bit about everything when it comes to computer networking. From fundamentals to anticipating future tech changes, there’s a lot of ground to cover. To keep up, you need to keep learning. If you’re wondering where to start, this list of 10 computer networking books can help.

Best Practices to Minimize Website Downtime

When a customer notifies you that your website is down, it has far more severe consequences than just embarrassment. Website downtime can mean loss of money, reputation, credibility and in a lot of cases, the overall feeling of security of your customers. As a survey report from Gartner showed website downtime can cost nearly $5,600 per minute to some companies. So, what are the issues that can cause website downtime, and how can you prevent it?

The evolving application lifecycle: from DevOps to DevSecOps

Every evolution in technology starts with the people behind it. So understanding the context, roles, and objectives that gave rise to DevOps — and now DevSecOps — isn’t just an exploration of timing and technology; it’s central to how we define organizational success. In this post, I’ll recap a conversation I had with Gareth Rushgrove, Director of Product Management at Snyk, a cybersecurity platform that helps developers identify vulnerabilities in their applications.

Contributing Third Party Flux Packages: A Discord Endpoint Flux Function

Are you currently using Flux with InfluxDB? Have you written a great Flux function that would be useful to the community? If the answers to these questions are “Yes!”, then I encourage you to contribute your awesome work to Flux, so that others can appreciate you and your work. Today, we’re sharing how you can contribute a custom Flux function in a Third Party Flux Package.

Monitor RethinkDB with Datadog

RethinkDB is a document-oriented database that enables clients to listen for updates in real time using streams called changefeeds. RethinkDB was built for easy sharding and replication, and its query language integrates with popular programming languages, with no need for clients to parse commands from strings. The open source project began in 2012, and joined the Linux Foundation in 2017.

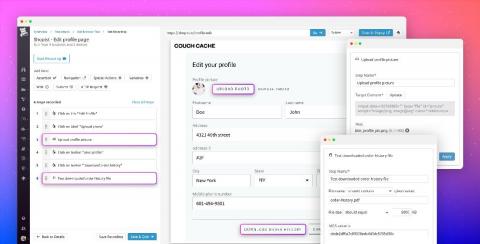
Test file uploads and downloads with Datadog Browser Tests

Understanding how your users experience your application is critical—downtime, broken features, and slow page loads can lead to customer churn and lost revenue. Last year, we introduced Datadog Browser Tests, which enable you to simulate key user journeys and validate that users are able to complete business-critical transactions.

Connecting the dots with Event Correlation

We can’t stress enough on the importance of event correlation in network monitoring. Our customers love correlation! For the love of event correlation we’ve published a blog on why modern organizations rely on event correlation. This is the second blog from the correlation series. You might want to read our previous blog before reading this one.