Operations | Monitoring | ITSM | DevOps | Cloud

Latest News

Grafana 7.0 sneak peek: Inspect drawer lets you get raw data and download as CSV

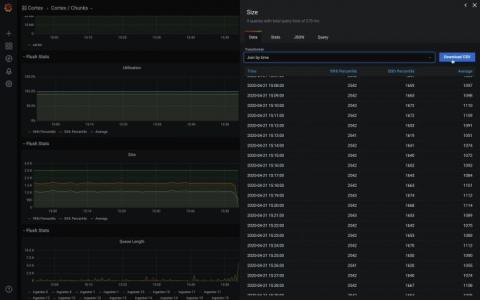
Grafana v7.0 is coming soon! Here’s another sneak peek of one of its features: the inspect drawer. The inspect drawer is a feature that every panel will support, including internal as well as external community plugins. In this new drawer, you will be able to view the raw data in a table format, apply some predefined transformations, and download as CSV. “Download as CSV” previously only existed as a custom feature for the Graph & Table panel.

How to Create Cost-Effective Infrastructure Monitoring

Out of the box monitoring solutions are getting more and more difficult to implement. In addition, they may not have the features you need, and they’re always becoming more expensive. It’s no wonder you’re trying to create a cost-effective solution via infrastructure monitoring cost management on your own by using a combination of your on-site development talent and a few open-source libraries.

Using logging for your apps running on Kubernetes Engine

Whether you’re a developer debugging an application or on the DevOps team monitoring applications across several production clusters, logs are the lifeblood of the IT organization. And if you run on top of Google Kubernetes Engine (GKE), you can use Cloud Logging, one of the many services integrated into GKE, to find that useful information. Cloud Logging, and its companion tool Cloud Monitoring, are full featured products that are both deeply integrated into GKE.

How to Extract Actionable Intelligence With C# Logging

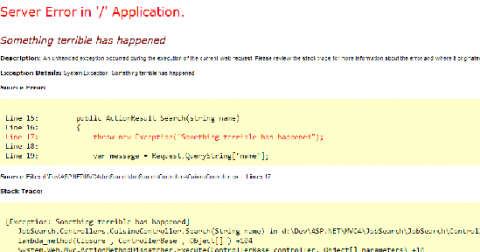
When applications are deployed in the production environment, developers expect them to work smoothly without any performance issues. However, applications often experience unexpected bottlenecks, making it crucial to monitor applications. One of the simplest ways to monitor a C# application is to emit, save, and index log data for search, analysis, and troubleshooting. We’ll discuss how you can monitor your applications while making the most of C# logging.

Dashbird's Lessons Learned from Launching a SaaS Application

From the development and operations side, launching a new software application can be quite challenging. Deciding which tools to use, how to organize the task pipeline, managing collaboration among team members, monitoring performance and potential issues after launch, etc. It’s not easy to get it done right. Dashbird recently went through all of this. Behind the scenes, our amazing development team worked really hard to overcome all challenges and deliver the best value to our users.

Challenges Monitoring ReactJS Applications

ReactJS combines the speed of JavaScript with unique rendering capabilities to make applications that are highly dynamic, performance oriented, and responsive to user input. State of JS report 2018 cites performance as the major reason ReactJS has gained so much popularity in such a short time. When it comes to options for building single-page applications (SPAs), React delivers performance advantages over Angular and other JavaScript frameworks and libraries.

Monitoring a Pulse Oximeter with InfluxDB - A Parent's Perspective

This article was contributed by Michael Hinkle, Probe Engineering and Manufacturing Supervisor at Texas Instruments. My name is Mike Hinkle, and I use InfluxDB to monitor my daughter’s pulse oximeter and to better understand her overall health. Through my career as an engineer, currently at Texas Instruments, I was aware of time series databases and I love to play with various technologies.

How to implement log management policies with your teams

Logs are an invaluable source of information, as they provide insights into the severity and possible root causes of problems in your system. But it can be hard to get the right level of visibility from your logs while keeping costs to a minimum. Systems that process large volumes of logs consume more resources and therefore make up a higher percentage of your overall monitoring budget. Further, log throughput can be highly variable, creating unexpected resource usage and financial costs.

Security configurations-Part two: 8 imperative security configurations for your arsenal

In part one of this two-part blog series, we discussed seven reasons security configurations are an important part of an organization’s security posture. In this part, we’ll look at eight security configurations that can help with ensuring comprehensive control over the endpoints, avoiding vulnerabilities, deploying security configurations, and automating a number of verticals of endpoint security.