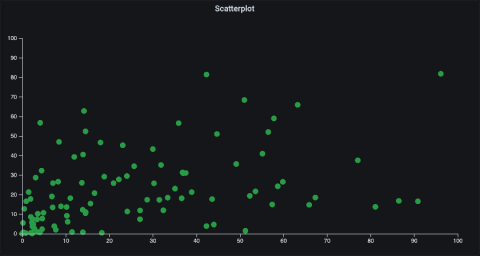
Learn Grafana: How to build a scatter plot plugin in Grafana 7.0
There are a lot of great things about Grafana 7.0, but one of my favorite features is the new React-based plugin platform, which has a set of new APIs and design system to help you build your own plugin. The process is easier and faster than ever. In this blog post, I’ll show how you can create a panel plugin for visualizing scatter plots. A scatter plot is a type of graph that displays values for (usually) two variables as a set of points along a horizontal and vertical axis.


