Operations | Monitoring | ITSM | DevOps | Cloud

Latest News

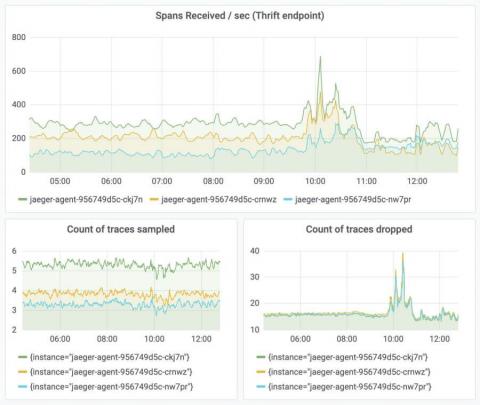
Use the Dashboard API to build your own monitoring dashboard

Using dashboards in Cloud Monitoring makes it easy for you to track important system metrics. Creating dashboards by hand in the Monitoring UI can be a time-consuming process, especially if you want to use them in multiple different Monitoring Workspaces. With the recent GA announcement for the Cloud Monitoring dashboards API, you now have a way to programmatically create dashboards.

The OpsRamp Monitor: SRE Salaries, DevOps Teams, Multi-Cloud Survey

Top Weekly Reads in IT I&O The OpsRamp Monitor is OpsRamp’s top weekly review of interesting developments and emerging trends in IT operations. In this issue: It’s been a week. Four U.S. presidential contenders dropped out of the race. Coronavirus got worse. Several major tech conferences have been canceled. And the stock market rollercoaster ride continued. Let’s refresh with some good news: your career.

Chrome 80 and Firefox 72.0.2 updates live on our checkpoints

When a new browser version becomes available, user adoption is fast. As we saw in an earlier post, due to the automatic update/release processes used by providers, most (nearly 100%) users have the latest and greatest within about four weeks of the new browser version’s release. As the browser versions evolve, it is important that your synthetic website monitoring keeps pace with the user-adoption rates.

Introducing wildcard-filtered metric queries

Tags are essential for your teams to quickly and efficiently filter through and find the information they need among the huge scope of data generated by your cloud infrastructure. Given that modern environments are always changing, with hosts and containers continuously being added or replaced, you need to be able to dynamically scope your queries so that you’re not rewriting the same searches over and over again.

Dynamic alerts

The power and value that’s embedded in logs are reflected by the status and behavior of our applications and infrastructure. Many times we would like to be alerted when the application or its components show abnormal behavior. This behavior can be reflected by the application sending some logs at a higher than usual volume. Figuring out exactly what ‘higher than usual’ means, or in other words, setting the threshold value at which the alert should trigger can be a daunting task.

Launching Application Control Plus: Build an infallible stronghold against all application-related threats

We’re pleased to announce the debut of ManageEngine Application Control Plus, an application whitelisting, blacklisting, and privilege management solution. IT operations could come to a standstill if applications suddenly ceased to exist, but applications can be considered double-edged swords. As important as applications are, they also form the largest threat vectors in any network.

Hybrid Monitoring Platform Selection 101: Top 5 Capabilities to Look For

When looking for a new monitoring platform, the options available today can seem overwhelming. SaaS, on-premises, cloud-native… where do you even start? Below, find a breakdown of five key capabilities to be on the lookout for when comparing IT monitoring platforms. Although some of these capabilities are now must-haves for all platforms, certain providers still offer up richer feature sets and benefits.