Operations | Monitoring | ITSM | DevOps | Cloud

Latest News

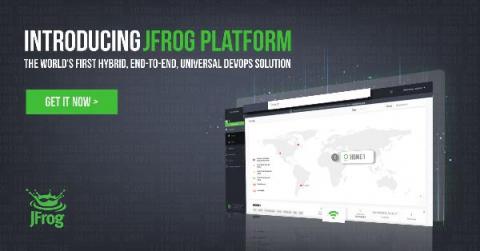
Joyful DevOps is Here: Introducing the JFrog DevOps Platform

Unity is strength. And at JFrog, we’re committed to providing the strongest DevOps tools available. With the promised release of the JFrog DevOps Platform, it’s my honor and delight to announce JFrog’s biggest leap yet toward fulfilling our universal vision of Liquid Software. We’re excited and proud to launch the world’s first universal, hybrid, end-to-end DevOps platform.

What are racks and which one should you buy?

A rack is a structure, usually made out of metal and cabinet or wall-shaped, which allows to store and organize the different components of computer installations, such as servers, storage systems, switches, etc. Is that it? Are you disappointed? Well, hold on, although they don’t seem like much, the world of racks can actually be quite tricky.

Monitor Apache Airflow with Datadog

Apache Airflow is an open source system for programmatically creating, scheduling, and monitoring complex workflows including data processing pipelines. Originally developed by Airbnb in 2014, Airflow is now a part of the Apache Software Foundation and has an active community of contributing developers. Airflow represents workflows as Directed Acyclic Graphs (DAGs), which are made up of tasks written in Python. This allows Airflow users to programmatically build and modify their workflows.

How Tackle Creates Customer Trust with Sentry

Regardless of the strength of your product, and the quality of your code, if the end result isn’t happy customers… What’s the point? For Tackle, a software company dedicated to helping ISVs turn the Cloud Marketplaces into repeatable, sustainable, and significant sources of revenue, customer experience is everything. As a software company serving other software companies, Tackle knows exactly what matters most to its customers, which is why they use Sentry.

OpenTracing, OpenCensus & OpenTelemetry: What is Distributed Tracing?

Software monitoring allows developers and IT professionals to observe events occurring within a monitored system. The data gathered by monitoring processes offers visibility into how the monitored entity is behaving and provides warning signs indicating that some aspect of the system deserves greater attention. More and more software is migrating to the cloud, and monolithic software is being decomposed into microservices to create distributed applications.

Looking at shadow IT through a new lens

Depending on who you ask, shadow IT, also known as stealth IT, falls somewhere on the spectrum between “persistent headache” and “total mystery.” If you ask someone on an actual IT team, they might tell you that shadow IT poses an existential threat to security and compliance. But their coworkers – the folks responsible for bringing rogue tech into the company – typically don’t even know what shadow IT is.

Connecting Prometheus-Ksonnet to Grafana Cloud

In a previous post we showed how to install Prometheus and Grafana using the prometheus-ksonnet library along with Tanka. This is great for getting a well-managed monitoring install going, but sometimes it isn’t enough for monitoring larger clusters. If you have multiple clusters that you want to monitor on a single dashboard, or need long-term storage, or need a high-availability setup for your monitoring data, then this installation won’t be sufficient on its own.

Azure Monitor (Part 3): Azure Monitor Logs - Solutions

In the previous post, we talked about connecting data sources to your Log Analytics workspace. While the data can be super useful, it is “unstructured” at this point – not really in the right shape to perform a specific task or enable useful monitoring of an application or a service. This is where “Solutions” come into picture (formerly called management solutions). Solutions can also leverage other services in Azure to perform many related actions, such as automation.