Operations | Monitoring | ITSM | DevOps | Cloud

Latest News

All together now: our operations products in one place

Our suite of operations products has come a long way since the acquisition of Stackdriver back in 2014. The suite has constantly evolved with significant new capabilities since then, and today we reach another important milestone with complete integration into the Google Cloud Console. We’re now saying goodbye to the Stackdriver brand, and announcing an operations suite of products, which includes Cloud Logging, Cloud Monitoring, Cloud Trace, Cloud Debugger, and Cloud Profiler.

What happens when a seasoned engineer goes on vacation?

Have you ever experienced a time when someone on your team takes off to recharge or takes unplanned downtime away from work? It may feel a bit scary as workloads shift, priorities change and the team has to pick up some slack. We all need to recharge and in some org’s, it’s imperative. The covering for each other builds trust among the team which is invaluable when you’re in the trenches daily, working hard.

Discovering anomalous patterns based on parent-child process relationships

As antivirus and machine learning-based malware detection have increased their effectiveness in detecting file-based attacks, adversaries have migrated to “living off the land” techniques to bypass modern security software. This involves executing system tools preinstalled with the operating system or commonly brought in by administrators to perform tasks like automating IT administrative tasks, running scripts on a regular basis, executing code on remote systems, and much more.

Business Monitoring: If You Can't Measure It, You Can't Improve It

“If you can’t measure it, you can’t improve it” …this quote by Peter Drucker and the philosophy behind it is a key driving force behind modern management and the introduction of BI solutions to support the scaling and increased complexity of businesses. Analytics tools were developed to enable metric measurement and business monitoring across large scale, complex systems and to enable continuous improvements of business performance.

A Peek at the Top Tools for API Monitoring

An API allows two systems to communicate with each other. APIs (application programming interfaces) are magnificent things as they connect services and allow us to transfer data back and forth between managed systems. If you manage an API that internal and external users rely on, its failure won’t only impact you. It will affect all users and systems connected to the API. The connectivity and interdependencies create vulnerabilities for application programming interfaces.

Self-Service Analytics for the Shop Floor [Part 2] - A Practical Example using MQTT

In the first part of this blog article, I introduced key concepts surrounding data ingestion for the industrial Internet of Things, the role and importance of metrics and self-services capabilities for shop floor personnel. So let's see how this looks in practice and how the knowledge of a process or control engineer can be turned into action.

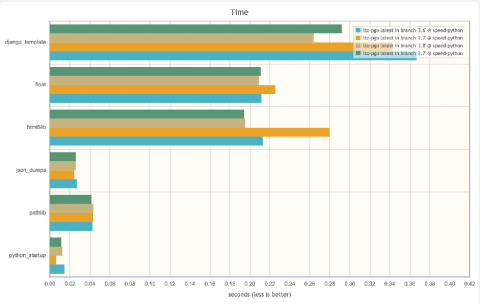
A Comprehensive Guide to Migrating from Python 2 (Legacy Python) to Python 3

Python powers many applications we use in our day-to-day like Reddit, Instagram, Dropbox, and Spotify. The adoption of Python 3 has been a subject of debate in the Python community. While Python 3 has been out for more than a decade now, there wasn’t much incentive to migrate from the stable Python 2.7 in the earlier releases. If you’re still running on legacy python, it’s high time to migrate as it has reached the end of its life since Jan 2020.

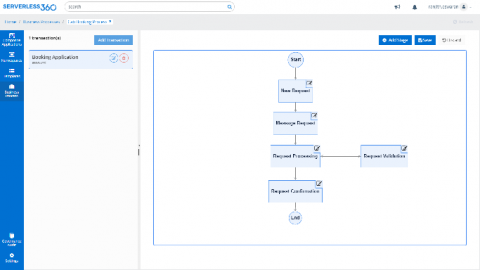
Serverless360 BAM - A Quick Walkthrough

In a real-time business scenario, various Azure services are integrated to define a business process. Day by day these business processes grow in complexity and monitoring them turns out to be a real challenge. In order to overcome these challenges, Serverless360 provides end-to-end tracking via Business Activity Monitoring.

Release 1.20: Kernel monitoring 'superpowers' and infrastructure-wide labels

In Netdata’s first major release of 2020, we’re introducing two new features on the opposite ends of the monitoring spectrum. On one hand, we’re releasing an eBPF collector, which lets you collect, monitor, and visualize incredibly precise metrics straight from the Linux kernel. On the other, we added the ability to label agents to help you organize entire infrastructures and see every important piece of information about streaming nodes in one place.