Operations | Monitoring | ITSM | DevOps | Cloud
Latest News
How Nutanix has changed the approach to virtual infrastructure monitoring
Reinventing any technology is an interminable process. When it comes to legacy infrastructure and virtualization, Nutanix took the giant leap to hyper-converged infrastructure (HCI). Dating back to 2009, Nutanix brought in HCI with the vision to invent a better way to build and manage data centers.
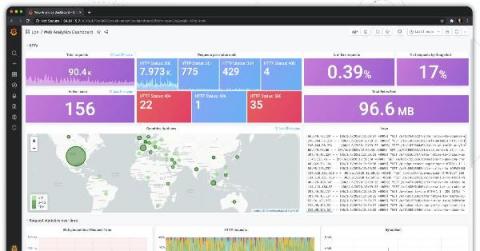
Grafana and NGINX are partnering to give the open source community a turnkey experience for visibility
Over the past few years, NGINX users have naturally gravitated toward Grafana, and vice versa. These days, it’s not uncommon to see these two open source tools used together in the wild. And for good reason. F5, which acquired NGINX last year, is prioritizing building visibility across the entire product set, to make it easy for customers to quickly gain the insights that they need. Meanwhile, Grafana has evolved into the primary visualization and analysis tool in the open source market.
Scaling Queue Workers Efficiently with AppSignal Metrics
Most web apps can benefit from a background queue, often used to process error-prone or time-consuming side jobs. These background jobs can vary from sending emails, to updating caches, to performing core business logic. As any background queueing system scales the number of jobs it needs to process, the pool of workers processing those jobs needs to scale as well.
SLOs for AWS-based infrastructure
Install SAP Data Intelligence 3.0 on an RKE Cluster
Rancher and SAP have been working on a dedicated verification of SAP Data Intelligence 3 (SAP DI) on Rancher Kubernetes Engine (RKE) cluster and Longhorn storage platform. This blog will guide you on how to properly install SAP DI on an RKE cluster.
SUSE Enters Into Definitive Agreement to Acquire Rancher Labs
I’m excited to announce that Rancher has signed a definitive agreement to be acquired by SUSE. Rancher is the most widely used enterprise Kubernetes platform. SUSE is the largest independent open source software company and a leader in enterprise Linux. By combining Rancher and SUSE, we not only gain massive engineering resources to further strengthen our market-leading product, we are also able to preserve our unique 100% open source business model.
The State of Event-Driven Automation
Talking about competition can be hard. It’s understandable. Product positioning can be touchy subjects especially when those use cases overlap. In the DevOps space, event-driven architectures are certainly not a new concept. Companies like Netflix, LinkedIn, and Facebook have in-house tools built specifically for this type of automation. However, Relay’s mission is make it easy for everyone to build event-driven workflows – not the Netflix-es of the world.


