Operations | Monitoring | ITSM | DevOps | Cloud
Latest News
MySQL Log File Location
Stateful Apps and Support of Persistent Storage
With enterprises and ISVs adopting containers and Kubernetes (k8s) to increase the agility and scalability of their applications, they would want more applications to be deployed on k8s. Applications can be a mix of stateful and stateless. Until recently, only stateless applications were supported by k8s. However, with the advent of persistent storage on k8s, stateful applications will be supported. In the pet Vs cattle analogy of service, you would want to treat the storage as cattle.
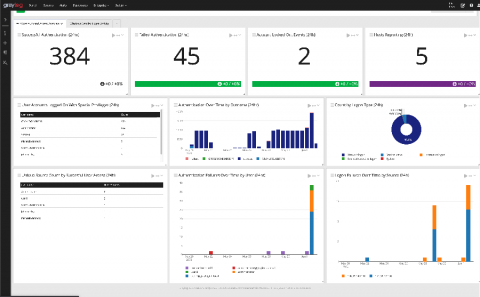
Announcing Graylog Illuminate for Authentication
Graylog Illuminate for authentication is a brand new offering designed by our Enterprise Intelligence team. It eliminates the manual setup necessary to detect, monitor, and analyze authentication activities and issues across your IT infrastructure by providing pre-built Dashboards, Alerts, and data enrichment. Initially, Graylog Illuminate for Authentication will address Windows authentication issues and activities. We will release additional data sources in the coming weeks so stay tuned!
Graylog Illuminate: The Story
Graylog is an advanced log management system, capable of ingesting all of your corporate logs into a central repository for easy searching and analysis of your data.
Quick start monitoring by using lightweight monitors
There are instructions to get started with IPHost Network Monitor, covering most typical situations. However, using the defaults (for both monitors parameters and for network discovery) when looking for hosts and/or monitors can result in rather slow setup. In most cases, it is simpler to create "draft", lightweight monitors just to make sure the service exists and accepts connections, and add actual protocol-specific checks as required.
Fyipe from HackerBay Now Available in the Microsoft Azure Marketplace
Microsoft Azure customers worldwide now gain access to HackerBay’s Fyipe to take advantage of the scalability, reliability, and agility of Azure to drive application development and shape business strategies.
Gaining Visibility and Control Over Solar Energy Storage Devices Using InfluxDB Cloud
Energy storage and sustainability are big issues in Hawaii, where oil tankers are shipped in everyday, just to keep the lights on. Resiliency in the energy grid, due to threat of natural disaster, is critical. Energy storage is needed to manage how much solar energy is coming into the market or into the grid. Properly managing the power entering the grid is vital for grid stability since Hawaii has intermittent energy that floods the grid.
What's New in Elasticsearch 7.7?
Elastic is prepping for Elasticsearch 8.0, but in the meantime is rolling out upgrades and features with Elasticsearch 7.7. The new version introduces asynchronous search as well as changes with Elasticsearch clusters, mapping, SQL enhancements, snapshots and machine learning. This post will cover just a few of the highlights of the new release. Besides asynchronous search, ES 7.7 also introduces multi-class classification, reduced heap usage, inference time features, and better password security.
Creating Histograms in Grafana from Prometheus buckets
In the following example, we will be creating a histogram in Grafana. Our datasource is Prometheus’s cumulative histogram. I have captured the metrics using micrometer’s distribution summary.


