Operations | Monitoring | ITSM | DevOps | Cloud
SCOM
The latest News and Information on Service Center Operations Manager and related technologies.
Webinar: Let your SCOM alerts talk with ChatGPT
Are you tired of spending endless hours sifting through alerts and troubleshooting incidents manually? We have some exciting news that could revolutionize the way you manage alerts! Our friends at TopQore are hosting a webinar on April 12th at 4 PM CEST (Europe - Amsterdam time) that will introduce the integration of SCOM with ChatGPT, a powerful AI language model developed by OpenAI.
Three Ways to Run Prometheus
Prometheus is an open source and free to use metrics collection and storage solution. It's used extensively in the industry for monitoring many different technologies. In this article I will show you how to get Prometheus up and running as a binary, a container running in Docker, and inside Kubernetes.
Microsoft System Center 2022
Managing data centers, the fundament for all IT infrastructure running business-critical workloads, especially for large-scale HA, and hybrid environments, can be a complex task. Microsoft System Center simplifies data center management across your IT environments. With the new Microsoft System Center 2022 release in April 2022, managing datacenters across diverse IT environments utilizing Windows Servers, Azure Stack HCI, and VMWare deployments on System Center is now even easier.
NiCE zLinux Management Pack 1.20 released
IBM zSystems run on some of the fastest processors. IBM zSystems are used for maximum speed and volume of data transactions, mainly in the banking, health care, airline, and retail sector. These markets need to rely on seven nines (99.99999%) of availability and performance of their systems, as they are the backbone of the entire business.
Metrics vs. Logs vs. Traces (vs. Profiles)
In software observability, we often talk about three signal types - metrics, logs, and distributed traces. More recently I've been hearing about profiles as another signal type. In this article I will explain the different observability signals and when to use them in a clear and concise way.
Microsoft's Cross-Platform Agent for System Center Operations Manager to Support Ubuntu 22 and RHEL 9
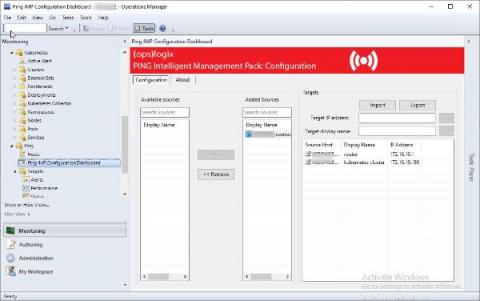
Ping Management Pack compatibility with SCOM 2022
Instrumenting Node.js code with Prometheus custom metrics
Automatic instrumentation is great, but to get the most out of your monitoring you often need to instrument your code. In this article I am going to explain how to instrument a Node.js express app with custom metrics using the Prometheus prom-client package. Although this article specifically addresses Node.js and express, my hope is that the general concepts are applicable to other languages too.
Next Level Oracle Monitoring: Options, Features, Deep-Dive
Get a guided tour on advanced Oracle monitoring based on Microsoft System Center Operations Manager.


