Grafana variables: what they are and how they create dynamic dashboards
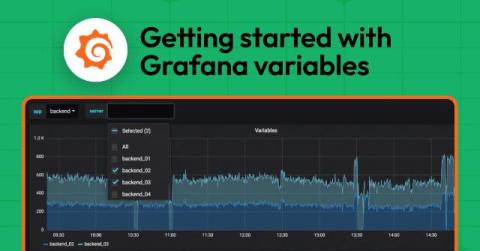
A common pattern when building Grafana dashboards is to represent data for many items at once, such as simultaneously monitoring hundreds of servers. But what if there’s a problem with one of those servers? You’d want the ability to quickly identify that single server, and drill into the details without noise from all the other systems. In Grafana, dashboard variables are a great way to filter data and focus on the information that’s most important to you.


