Operations | Monitoring | ITSM | DevOps | Cloud

%term

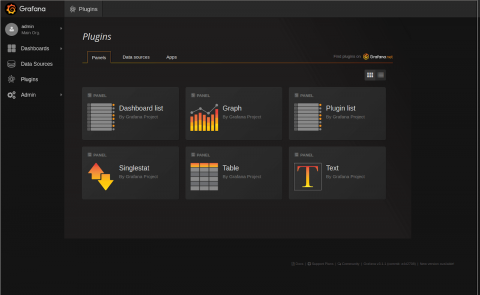
The (Mostly) Complete History of Grafana UX

Before Grafana, there was Kibana 3. Kibana was revolutionary when it came out, because it allowed you to use Elasticsearch in a very new way, for log analytics and not just normal document search, and to build dashboards without writing JSON documents. It had this nice UI, which let you drag panels around. But editing panels was a little tricky; you could only edit them in this sort of fullscreen modal. Still, it was really good for its time.

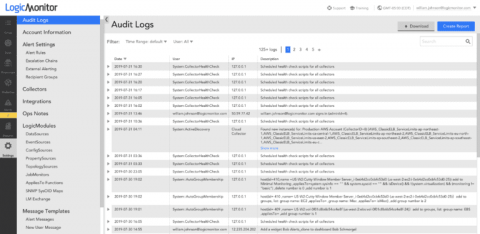
The Power of Audit Logs

If you’re a LogicMonitor customer, the platform’s Audit Logs may seem like a rudimentary means to track user actions, but they can actually be a powerful tool for troubleshooting and getting historical data within your portal. For instance, let’s say you notice that the alerting for a particular device group has been unexpectedly disabled.

Introducing Scheduled Reporting

We’re happy to announce the release of Logz.io Reports — an easy way to set up scheduled reporting for both operational and security use cases. Kibana dashboards provide you with a window into your environment, visualizing the different signals being tracked in a beautiful mix of graphs, charts, and maps. Often used in times of crisis and as the starting point for an investigation, dashboards can also be useful as a static reporting tool for multiple use cases.

Automation Everywhere: The Key to Reimagining IT & the Role of the CIO

The world is undergoing profound change and technology sits at its beating heart. Digital transformation offers unprecedented opportunities for CIOs to support business demands for innovation-fueled growth. In so doing, IT leaders can also cement their position as indispensable members of the executive suite.

Honeybadger Integration with Scout

We are happy to announce that Scout now integrates with the popular error monitoring solution, Honeybadger. This integration brings a similar feature set to our existing Rollbar, Sentry and Bugsnag integrations, and it allows you to see your errors and exceptions alongside your performance metrics all on a single page. So let’s take this opportunity to take a closer look at Honeybadger and see how you can get it setup within Scout in just a few minutes!

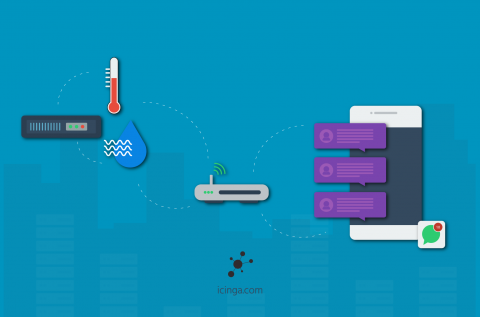
Environmental Monitoring and Alerting via Text Message

We are proud to announce that icinga.com is now also hosting integrations of hardware for monitoring environmental sensors and alerting via text message. The devices from the manufacturers listed on Icinga Integrations can easily be implemented into your Icinga monitoring by using plugins provided on Icinga Exchange.