Operations | Monitoring | ITSM | DevOps | Cloud
%term
Sick of information silos? Here's how to break them down
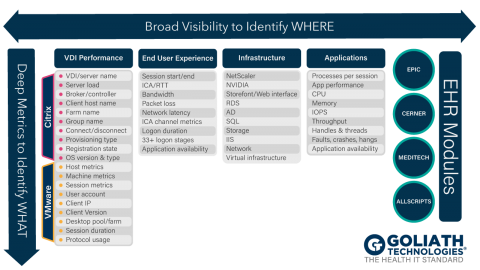
Advanced Logon Duration Troubleshooting with Goliath Performance Monitor
When we virtualise desktops and applications in a Citrix environment, one of the most important success factors is providing end-users with quick logons to those resources. This is often a difficult challenge that usually result in hours of tweaking, fine-tuning, and lengthy testing.
Streamlined Authentication, More Plugins, and Better Permission Structures with Grafana Enterprise
With the recent release of Grafana 6.3 substantial refactoring and improvements to plugins, external auth systems, and permissions have been introduced in Grafana Enterprise. Let’s take a look at some of the latest Enterprise features here.
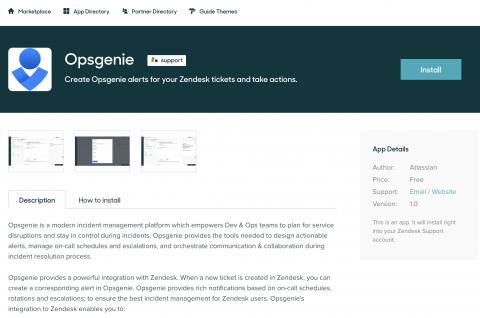
Opsgenie's new app is live in the Zendesk Marketplace
Our new app makes it incredibly easy for Zendesk users to escalate customer-reported issues to the proper team, right from the Zendesk UI. Customer service agents can also check on the status of existing alerts without leaving their dashboard. The launch of this app is more critical than ever, as constantly changing customer expectations demand that IT and service companies are high performing and always on.
Monitoring Microservices - Stack Doctor
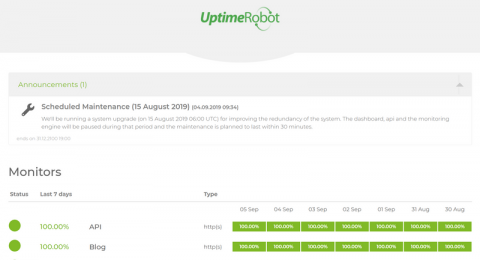
New Feature: Announcements for the Status Pages (Pro Plan)
A status page is a very easy-to-setup, nice and automated way to share the status of the websites/servers with visitors, users and teammates. And, the ability to share additional info with users like current issues or an upcoming maintenance can only make it better.
Monitor system access and unusual activity with Okta logs and Datadog
Okta is a cloud-based identity management service that provides authentication and authorization tools for your organizations’ employees and users. You can use Okta to incorporate single sign-on, multi-factor authentication, and user management services right into your applications.
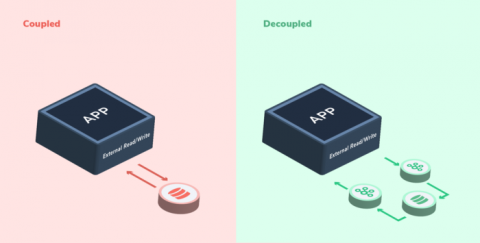
Avoiding death by external side effects - a tale of Kafka Streams
At Coralogix, we strive to ensure that our customers get a stable, real-time service at scale. As part of this commitment, we are constantly improving our data ingestion pipeline resiliency and performance. Coralogix ingests messages at extremely high rates — up to tens of billions of messages per day. Every one of these records needs to go through our entire pipeline at near real-time rates: validation, parsing, classification, and ingestion to Elasticsearch.
Creating the Perfect Grafana Dashboard
For a lot of DevOps engineers and SREs, a Grafana dashboard is often the beginning of a troubleshooting procedure. It might be an alert in Slack or a colleague pointing out anomalous system behavior. Or maybe it’s just part of your day-to-day monitoring workflow. Whatever the reason, staring at a beautiful Grafana dashboard is the starting point of what can be either a long and excruciating process, or a short and efficient one.


