Operations | Monitoring | ITSM | DevOps | Cloud
%term
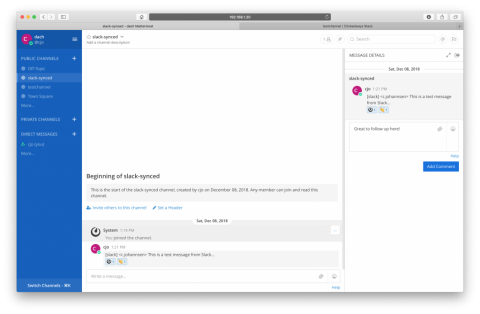
Mattermost Recipe: How to sync existing chat systems with Mattermost
Here’s the next installment in our Mattermost Recipes series. The goal of these posts is to provide you with a solution to a specific problem, a discussion about the details of the solution and some tips about how to customize it to suit your needs perfectly. If there’s a Recipe you want us to cook up in the future, drop us a line on our forum.
Gain End-to-End Intelligence Across Your Customer Experience and Application Performance with Latest Updates to AppDynamics
This month, we are excited to deliver additional AppDynamics functionalities across observability, intelligence, and usability that will help enterprise companies gain end-to-end intelligence across customer experience and application performance.
SecOps Is Getting Real (Time)
Companies migrating to the cloud need to ensure they have a strong security posture and can meet compliance requirements. Along with ensuring compliance, companies also are faced with the challenge of tying together multiple security tools that generate a high volume of event data across disparate interfaces and platforms. To help address this challenge, a new security service was introduced at AWS re:Invent 2018: AWS Security Hub.
WAN monitoring: changes associated with the Internet-based model
When we think about WAN monitoring we usually start from the basics: the behaviour of remote communication links will directly affect the performance of our applications. Therefore, we understand that if traffic over the communications link experiences high levels of latency this will negatively impact the response time that our users observe when accessing the applications.
How to Analyze Game Data from Killer Queen Using Machine Learning with Sumo Logic Notebooks
This year, at Sumo Logic’s third annual user conference, Illuminate 2018, we presented Sumo Logic Notebooks as a way to do data science within the Sumo Logic platform. Sumo Logic Notebooks integrate Sumo Logic data, data science notebooks and common machine learning frameworks.
Monitor Response Time ...new feature!
We've just rolled out a brand new feature: response time monitoring. As well as monitoring websites for uptime and downtime we now monitor the time it takes for each website to respond. The response times are logged and can be viewed in graphical format. Read on to see some pretty graphs of response times...
KubeCon 2018 + CloudNativeCon Recap
KubeCon + CloudNativeCon North America 2018 was an incredible event. We had many exciting announcements – LogDNA’s new partnership with IBM Cloud, our recent round of funding, as well as great conversations, product demos, fun giveaways, and even surprise gifts for loyal customers, our booth was jam packed.
Monitoring Kubernetes, part 1: the challenges + data sources
Our industry has long been relying on microservice-based architecture to deliver software faster and safer. The advent and ubiquity of microservices naturally paved the way for container technology, empowering us to rethink how we build and deploy our applications. Docker exploded onto the scene in 2013, and, for companies focusing on modernizing their infrastructure and cloud migration, a tool like Docker is critical to shipping applications quickly, at scale.
The Multi-faceted Use Cases and Benefits of Application Performance Monitoring Tools in Enterprise IT
Application performance monitoring (APM) solutions are among the most essential tools for IT today. As organizations undertake transformational initiatives such as cloud migration, container orchestration and microservices, they need to be able to manage performance of their business-critical applications and end-user experience across complex and sophisticated technology landscapes.


