Operations | Monitoring | ITSM | DevOps | Cloud

%term

Zipkin vs Jaeger: Getting Started With Tracing

Request tracing is the ultimate insight tool. Request tracing tracks operations inside and across different systems. Practically speaking, this allows engineers to see the how long an operation took in a web server, database, application code, or entirely different systems, all presented along a timeline. Request tracing is especially valuable in distributed systems where a single transaction (such as “create an account”) spans multiple systems.

Runtime container security - How to implement open source container security (part 1).

Container security is top-of-mind for any organization adopting Docker and Kubernetes, and this open source security guide is a comprehensive resource for anyone who wants to learn how to implement a complete open source container security stack for Docker and Kubernetes.

Exception Perceptions: Everything is Cool When You're Part of a Team

Welcome, and thanks for joining us! Today on Exception Perceptions, we’re inviting Sentry Product Manager Sara Gilford to give us all the dirt on collaboration and ownership. That’s right; we’re uncovering the juicy details of who and how folks on teams within Sentry should be notified when issues pop up in their application.

Part I: How not to structure your database-backed web apps

Most scientific papers are unlikely to change your day-to-day approach as a Rails web developer. How not to structure your database-backed web applications: a study of performance bugs in the wild Yang et al., ICSE’18 is the exception to that rule. This study examined 12 popular, mature, opensource Rails apps for ActiveRecord performance anti-patterns. And boy, did they find some issues.

Watchdog: Auto-detect performance anomalies without setting alerts

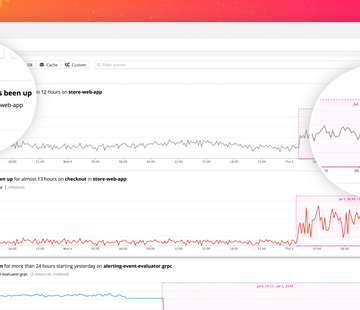
With anomaly detection, outlier detection, forecasting, and composite alerting, Datadog enables you to reliably alert the right people at the right time. But what happens when latency starts to increase, or error rates spike, in areas of your application where you haven’t set alerts? That’s what Watchdog is for.

Introducing APM Trace Search & Analytics with infinite cardinality

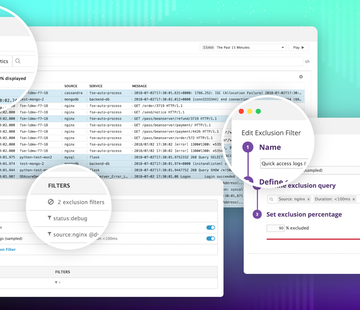
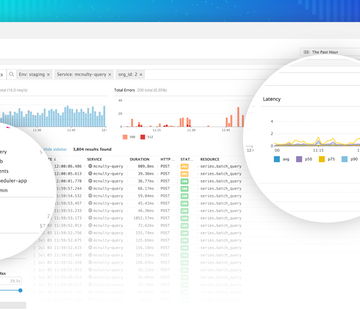
Distributed tracing provides a detailed view into application performance. Each trace shows you how an individual request was executed in your app: which user did what, which services were involved, how long it took, and whether the request executed successfully. Capturing that level of detail across hundreds or thousands of services provides a vast trove of information for troubleshooting and performance optimization, but it’s not always easy to find the exact trace events you need.

Enterprises Thrive in the Digital Era By Connecting Business Performance to Application Performance with AppDynamics

San Francisco - July 12, 2018 -AppDynamics , a Cisco company and the leader in application intelligence, today celebrated industry-leading customers across the globe for their advancement in digital progress; flourishing in today’s ever-evolving digital age by connecting application performance to business performance based on real-time data through AppDynamics’ business performance monitoring solution, Business iQ.