Operations | Monitoring | ITSM | DevOps | Cloud

Product Release

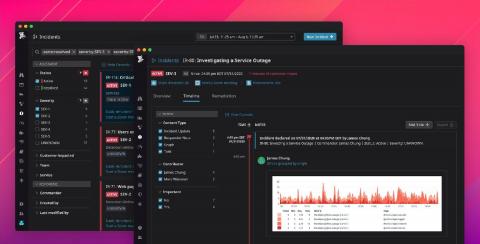
Incident Management with Datadog

When your application experiences an outage, the tools your team uses to manage its response can make all the difference in how quickly they resolve the problem and avoid it in the future. An effective incident management workflow depends on accessible, integrated tools as well as clear, direct channels of communication. And, even after the matter’s been resolved, documentation and analysis of an outage is vital to ensuring it never happens again.

Introducing, Dashbird Atlas

We’re pleased and honored to be part of the Serverless revolution - continuously innovating to make processes and day-to-day tasks for serverless users more efficient, seamless and enjoyable. So let’s get right into the new and exciting stuff now! Earlier this year, Dashbird launched the very well-received Insights Engine designed to encourage a proactive approach when building and operating serverless applications.

Kubernetes 1.19 release candidate available for testing

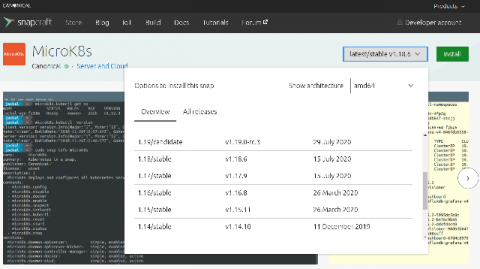
The Kubernetes 1.19 release candidate is now available for download and experimentation ahead of general availability later this month. You can try it now with MicroK8s. To get the latest Kubernetes on your machine, install MicroK8s and get a lightweight, zero-ops K8s cluster in no time: Or install from https://snapcraft.io/microk8s and select 1.19/candidate You can install MicroK8s on Ubuntu and all major Linux distributions or on Windows and macOS using native installers.

Website Monitoring with SIGNL4

SIGNL4’s core job is to reliably alert operational teams. However, we’ve been asked a couple of times if SIGNL4 can also monitor a website’s uptime. Well, we developed an app and it is now available in the SIGNL4 app gallery. You can now monitor the availability of websites AND get instantly alerted if is goes down. This can be set up in minutes. The new SIGNL4 app “Website Monitoring” checks the availability of a website and queries its URL in configurable intervals.

AppSignal Ruby Gem 2.11: Active Job and Friends

We just released Ruby Gem 2.11. We are always making things easier to use for you, so more things work out of the box and more instrumentation and dashboarding is built without you doing any heavy lifting. This release has a big overhaul of Active Job support. The cherry on the stroopwafel cake is the automatically generated dashboard with status per queue, queue throughput and queue times. 2.11 also polishes a lot of other integrations. Let’s dive in.

Make sense of SCOM Alerts with SquaredUp 4.7

One of the most common complaints about SCOM is the noisiness of alerts from Management Packs. Getting on top of these alerts can be a huge challenge and often the thing that most gets in the way of an organization getting value out of SCOM. In SquaredUp for SCOM 4.7, our recent feature-packed update, we bring you three new alert-handling super-powers to help you get on top of alerts.

New in Grafana 7.1: Gain new data insights with InfluxDB and Flux query support

The audience was buzzing when Ryan McKinley, VP of Innovation at Grafana Labs, demoed the new native support for InfluxDB Flux queries in his talk at the InfluxDays virtual conference in late June. Whether the goal is to build IoT applications, or monitor DevOps infrastructure or another application or system, it’s important to move beyond just visualizing the data.

Netdata Agent v1.24: Prometheus/OpenMetrics collector and multi-host database mode

This release broadens our commitment to open standards, interoperability, and extensibility with a new generic Prometheus collector that works seamlessly with any application that makes its metrics available in the Prometheus/OpenMetrics exposition format, including support for Windows 10 via windows_exporter. Netdata will autodetect over 600 Prometheus endpoints and instantly generate charts with all the exposed metrics, meaningfully visualized.