Operations | Monitoring | ITSM | DevOps | Cloud

Product Release

Announcing the General Availability of Playwright Test Support

Back in October of 2022 we unveiled the beta of @playwright/test. We’re now happy to announce that Playwright Test (PWT) is now generally available! We’ve worked hard to make Checkly the best way to run your Playwright tests, and we’ve also decided to make Playwright—which is experiencing a surge in usage and popularity— the default and recommended web testing framework to use with Checkly.

What's new in Calico Enterprise 3.16: Egress gateway on AKS, Service Graph optimizations, and more!

We are excited to announce the early preview of Calico Enterprise 3.16. This latest release extends the active security platform’s support for egress access controls, improves the usability of network-based threat defense features, and scales visualization of Kubernetes workloads to 100s of namespaces. Let’s go through some of the highlights of this release.

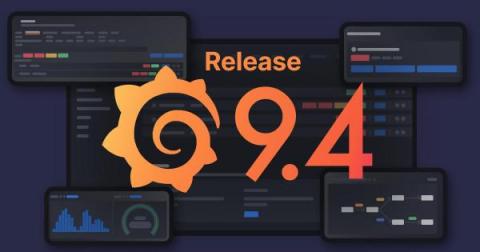
Grafana 9.4 release: Easy data source setup, custom panels, Grafana Alerting updates, and more

Grafana 9.4 is here! Get Grafana 9.4 With the latest Grafana release, we’re introducing a wealth of new features and improvements that makes getting started with Grafana even easier and that take your visualizations and observability best practices to the next level. In addition to enabling TraceQL, the new query language for distributed tracing in Grafana Tempo 2.0, for all Grafana Cloud users, the Grafana 9.4 release comes with a fresh round of features.

Azure Stateful Node is now in General Availability

We are excited to announce that Azure Stateful Node is now in General Availability. This unique, proprietary development follows the ongoing success of AWS Stateful Node and the increasing demand from our customers working in Azure. With Azure Stateful Node, Spot by NetApp’s customers can now run their stateful compute workloads on Azure with up to 90% immediate cost reduction and maximum availability.

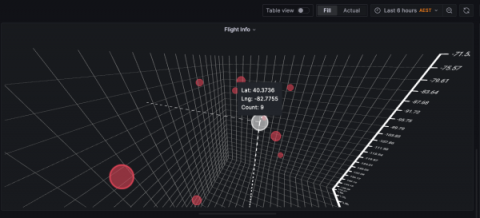
Introducing the XYZ chart: A three-dimensional way to visualize your data in Grafana

This panel is in alpha version and still in development. To use it as is, you need to modify your configuration file and set enable_alpha = true in the panels section. More information can be found on this page. Two-dimensional graphics are the de facto way to visualize data within the observability realm, and Grafana is really good at plotting data this way.

Introducing OpenTelemetry Support: Take Action on Your Observability Data

As an open source company that grew out of a side project in 2008 to an application and performance monitoring platform (APM) used by over 3.5 million developers, Sentry is committed to open source and the community of developers maintaining and building in the open. Similarly, we take a public approach to building our software, which is why it’s a natural extension of our values to announce our support for OpenTelemetry (or OTel), the leading open standard for observability.

NiCE AIX Management Pack released

From industrial business applications to finance and supercomputers, AIX runs the most demanding mission-critical workloads smoothly. AIX, IBM’s Advanced Interactive eXecutive, is a highly secure and reliable OS, which is why performance- and dependability-driven industries use AIX for their enterprise servers. In fact, the majority of Fortune 500 health care, telecommunications, energy, and financial companies run on AIX.

Raygun API Beta is now open to everyone

We’re excited to announce the offical Beta launch of the Raygun API, allowing you to extract, manipulate, and visualize insights from your account in innovative ways. This is included with all Raygun plans, and is now readily available to customers of all sizes. We’ve made the decision to release this Beta sooner than anticipated, as we’re eager to receive your early feedback to make sure we’re focussing on the endpoints that provide the most value to your team and business.