Operations | Monitoring | ITSM | DevOps | Cloud

Product Release

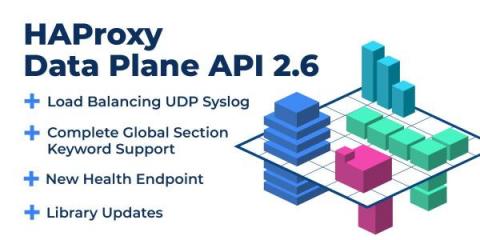
Announcing HAProxy Data Plane API 2.6

In HAProxy Data Plane API version 2.6, we continued the effort of expanding support for HAProxy configuration keywords, as this has been the priority with this release cycle, and it will be in the next one too to meet our goal of achieving complete feature parity with both the HAProxy configuration and Runtime API. This will enable you to use HAProxy Data Plane API for configuring HAProxy without any gaps in functionality.

New Features and Enhancements in SQL Server 2022

In the era of technology defined by cloud computing, features evolve at the blinding speed of continuous deployment. When large software development organizations like Microsoft deliver semi-annual releases of products, like SQL Server, the volume of new features can be so large they can be hard to grasp. Microsoft continues to push the boundaries on what’s possible, both in on-premises and cloud data platforms, and they aim to make the life of data professionals much more manageable.

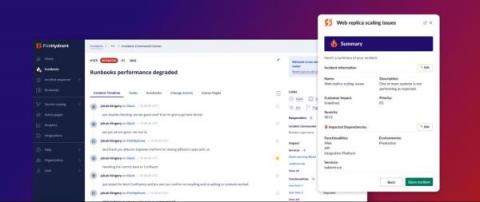
Our fully-redesigned incident response experience delivers a more intuitive workflow

Today we’re releasing fully redesigned Slack and Command Center experiences for FireHydrant so anyone on your team can intuitively navigate the incident response process — in the app or on the web. There are many things you can do ahead of an incident to help things run smoothly: design and document your process, automate predictable steps, train the team, and run drills.

Announcing the New GitKraken Help Center

We’re very excited to launch the new GitKraken Help Center to better serve ALL of our customers across our suite of Git tools, and to showcase our commitment to not only building great tools, but enabling our customers with all the onboarding, training and support resources they need to be successful in the way they work.

New in Grafana 9: The Prometheus query builder makes writing PromQL queries easier

When Grafana started in 2014, its main goal was to be a great dashboarding solution for Graphite. Around the same time, the Prometheus project started to gain steam, but it wasn’t clear whether it should be added to Grafana. After all, Grafana was a Graphite frontend, it was uncertain at the time if Prometheus would take off in popularity, and it would take resources away from the core purpose of why Grafana was created.