Operations | Monitoring | ITSM | DevOps | Cloud

Product Release

Elastic Observability 8.1: Visibility into AWS Lambda, CI/CD pipelines, and more

Technologies such as serverless computing frameworks and CI/CD automation tools help accelerate software development lifecycles (SDLC) to give development teams a competitive edge in the marketplace. Armed with these technologies, teams can deploy and innovate faster and more frequently by automating repetitive tasks and eliminating the need to manage or provision servers.

Elastic Enterprise Search 8.1: Enhanced web crawling and SharePoint on-prem connectivity

The 8.1 release of Elastic Enterprise Search features faster and more efficient content ingestion with the latest enhancements to the Elastic web crawler, with additional troubleshooting capabilities as well. This release also features the addition of SharePoint Server to our library of prebuilt connectors to enable aggregation of on-premises SharePoint Server content into Elastic for seamless search.

Now available: Direct monitoring

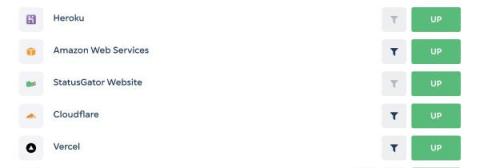
For more than 7 years, StatusGator has monitored the world’s status pages and aggregated the status of more than 1,000 cloud services into custom dashboards. With a quick glance, you can see the status of every service you depend on. But what if a website you depend on does not have a status page? What about internal tools, sites you host yourself, and other services without public status information?

Monthly Moo March 2022

What a start to 2022 has been for us all. We are incredibly proud of the continuous innovation, velocity and delivery of new features and functionality. We’ve heard success story after success story from our brilliant customers, each unique in their own way and continue to collaborate with them on our roadmap. So, this March update is for you and a massive thank you. We couldn’t do it without you, and it’s been our honor to be part of your success.

New in Grafana 8.4: How to use full-range log volume histograms with Grafana Loki

In the freshly released Grafana 8.4, we’ve enabled the full-range log volume histogram for the Grafana Loki data source by default. Previously, the histogram would only show the values over whatever time range the first 1,000 returned lines fell within. Now those using Explore to query Grafana Loki will see a histogram that reflects the distribution of log lines over their selected time range.