Operations | Monitoring | ITSM | DevOps | Cloud

%term

Prometheus vs. Graphite: Which Should You Choose for Time Series or Monitoring?

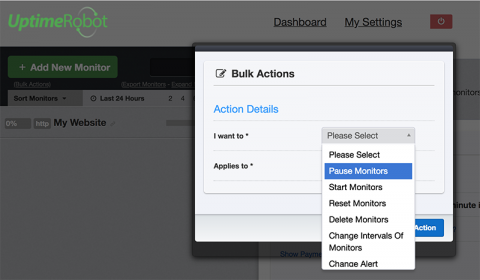
One of the key performance indicators of any system, application, product, or process is how certain parameters or data points perform over time. What if you want to monitor hits on an API endpoint or database latency in seconds? A single data point captured in the present moment won’t tell you much by itself. However, tracking that same trend over time will tell you much more, including the impact of change on a particular metric.

Tech news sites lagging when it comes to mobile

We all read them, and we all have our favorite technology news and media sites. Now that mobile dominates the market and Google has shifted to ranking based on mobile performance, we thought it would be fun to see how ready the top 50 technology news and media websites are for the shift using our free Website Speed Test Tool.

Three Keys to Incident Response: On-Call Schedules, Escalation Policies, and Routing Rules

Organizations are drowning in alerts, incidents, and chaos that prevent them from doing their jobs and serving their customers. Notably, for businesses who operate always-on services, an outage or downtime can be devastating to their bottom line, not to mention a poor experience for their customers and users.

Node.js monitoring with Datadog APM and distributed tracing

Node.js is an asynchronous JavaScript runtime that is used to develop highly scalable network applications. To help provide more visibility into these dynamic environments, we’re pleased to announce that Datadog APM has officially released support for monitoring Node.js applications, which joins our existing support for Java, Ruby, Python and Go.