Operations | Monitoring | ITSM | DevOps | Cloud

Dashboards

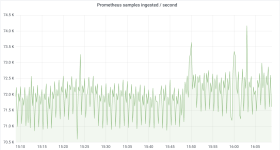
New in Grafana 7.2: $__rate_interval for Prometheus rate queries that just work

What range should I use with rate()? That’s not only the title of a true classic among the many useful Robust Perception blog posts; it’s also one of the most frequently asked questions when it comes to PromQL, the Prometheus query language. I made it the main topic of my talk at GrafanaCONline 2020, which I invite you to watch if you haven’t already. Let’s break the good news first: Grafana 7.2, released only last Wednesday, introduced a new variable called $__rate_interval.

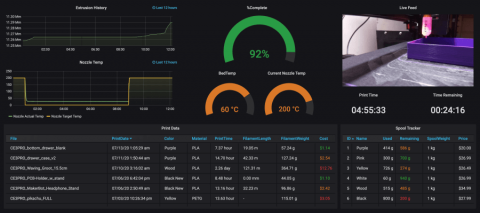
How I'm using Grafana and Prometheus to monitor my 3D printing

My name is Jonathan Stines, and I am a Penetration Tester for Rapid7, a cybersecurity company located in Austin, Texas. A small handful of my former colleagues at Rapid7 now work at Grafana Labs and have said it was a pretty cool spot to have landed. I had a vague understanding of what Grafana was, but what really struck my interest was when I saw their sweet dashboards in the HBO series Silicon Valley.

Putting anomalies into context with custom URLs in Kibana

Machine learning in the Elastic Stack provides you with an intuitive way to detect anomalies in vast data sets. But even the most sophisticated anomaly detection job might not reveal the root cause of anomalous behavior. After an anomaly is detected, you may need to dive into further analysis, review multiple corresponding metrics, and investigate how they relate to the anomalous spike.

How we use the Grafana GitHub plugin to track outstanding pull requests

First of all, we’re pleased to announce the first release of the GitHub data source. The source code is available at github.com/grafana/github-datasource. Contributions, feature requests, and bug reports are welcome. Using the GitHub data source, Grafana users can visualize data from GitHub’s API. In this blog, we’ll go over some use cases for this handy plugin.

Introducing Grafana Metrics Enterprise, a Prometheus-as-a-service solution for enterprise scale

Today, we announced the launch of a new Grafana Labs product: Grafana Metrics Enterprise, a scalable Prometheus-compatible service designed for large organizations that is seamless to use and simple to maintain. Over the past few years, Prometheus has risen in popularity to become the de facto monitoring system for the cloud native ecosystem around Kubernetes — and for good reason.

Keeping Clean with CloudZero Dashboard: Our Latest Updates

Here at CloudZero, we’ve made some updates to our dashboard that we’re excited to share with you! I actually prefer this original definition. When you hear the word dashboard, if you’re not thinking about software, you’re probably picturing the place in a car where you have various dials and readouts for safe operation of the vehicle. But did you know what the term dashboard predates cars?

Dashboards Beta v0.7: Export Dashboard to PNG/PDF and Self-Service Install for Splunk Cloud

If you’re new to the Dashboards Beta app on Splunkbase and you’re trying to get started with building beautiful dashboards, this "Dashboards Beta" blog series is a great place to start. The Splunk Dashboards app (beta) brings a new dashboard framework, intended to combine the best of Simple XML and Glass Tables, and provide a friendlier experience for creating and editing dashboards.