Operations | Monitoring | ITSM | DevOps | Cloud

%term

Scout Visits Cookpad in Japan

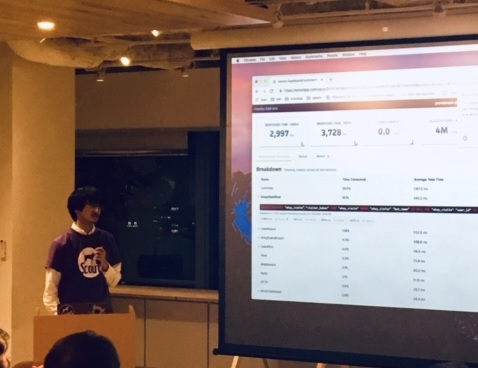
The Tokyo Scout team attended Rails Tokyo #37, a Rails focused get-together that is open to any Rails topic. It was hosted at the Cookpad office in Tokyo, which has some of the best Rails engineers in Japan. In this large open area there were tables, a screen for presentations and a large kitchen island. At these Cookpad events, Cookpad provides an extensive meal prepared in house by a chef!!

Introduction to Digital Experience Monitoring

The world is in a digital revolution, change is happening and with it, new industries are being born. Enterprises in all sectors are creating new and diverse revenue streams and disrupting old and established business models. In fact, I am convinced we are all working and living during one of the largest business revolutions in history.

Uptime 101: Measuring Your Overall Domain Health

High-level thinking thrives on interactive reporting. A wealth of data provides great minds with what they need to draw meaningful insights. Teams can then make informed decisions with measurable outcomes. Troubleshooting domain performance and server management both require ample data for root cause analysis. You’re not just looking for downtime. Instead, you’re studying overall performance and tracking incidents as they unfold.

AWS GuardDuty Monitoring with Logz.io Security Analytics and the ELK Stack

Last month, we announced Logz.io Security Analytics — a security app built on top of the ELK Stack, offering out-of-the-box security features such as threat intelligence, correlation, and premade integrations and dashboards. In this article, I’d like to show an example of using both the ELK Stack and Logz.io Security Analytics to secure an AWS environment.

Datadog's AWS re:Invent 2018 guide

Each November, AWS re:Invent draws thousands of AWS staff, partners, and users to Las Vegas for an intense week featuring all things AWS and AWS-related. As always, Datadog will be there and we’d love to meet you in person. Our engineers are excited to show off the new features they’ve been building and to answer your monitoring questions!

Ryan Betts [InfluxData] | Lessons and Observations Scaling a Time Series Database | InfluxDays 2018

InfluxData builds a Time Series Platform primarily deployed for DevOps and IoT monitoring. This talk provides several lessons learned while scaling the platform across a large number of deployments—from single server open source instances to highly available high-throughput clusters.

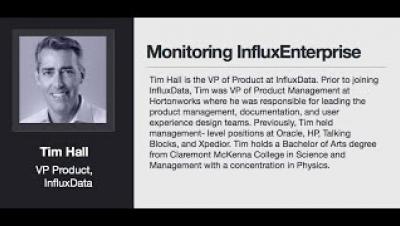
Tim Hall [InfluxData] | Monitoring InfluxEnterprise | InfluxDays 2018

You use InfluxData to monitor the performance of your infrastructure and apps—so it is equally important to keep your InfluxEnterprise instance up and running. Tim Hall, InfluxData VP of Products, will outline why and how you can monitor InfluxEnterprise with InfluxDB.

Gartner positions SCOM as a top APM tool

SCOM surged forward as an application performance management (APM) tool this summer. It received a Customers’ Choice 2018 award from Gartner in the APM category. SCOM shared the honour with AppDynamics, Dynatrace, New Relic and Solarwinds. I see you thinking – how did this happen? Well, more than 50 reviewers gave SCOM an average rating of 4.2, which means it met Gartner’s criteria to win the award.

Migrating to AWS Without Losing (Too Much) Sleep

As my fellow CIOs are well aware, the rapid changes to our digital economy can seem daunting. Despite the challenges of our digital world, Wyndham Hotels & Resorts, the world’s largest hotel franchisor, executed a significant digital transformation requiring change from our North American hotel owners that ultimately enabled them to provide better service to their guests.