Operations | Monitoring | ITSM | DevOps | Cloud

Datadog

Visually replay user-facing issues with Zendesk and Datadog Session Replay

Zendesk provides support teams with an integrated solution for processing all types of customer inquiries and feedback. But as organizations scale, support tickets can multiply, making it difficult to parse customer feedback and investigate issues promptly and thoroughly. Customers often report problems without providing the detailed context needed for effective troubleshooting.

Monitor processes running on AWS Fargate with Datadog

Serverless platforms like AWS Fargate enable teams to focus on delivering value to customers by freeing up time otherwise spent managing infrastructure and operations. However, maintaining a deep level of observability into applications running on these fully managed platforms remains challenging.

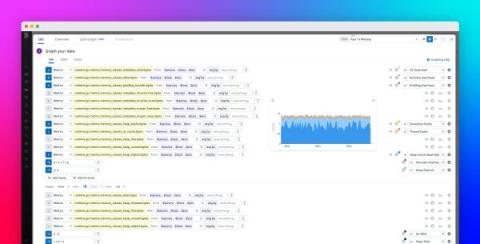
Go memory metrics demystified

For engineers in charge of supporting Go applications, diagnosing and resolving memory issues such as OOM kills or memory leaks can be a daunting task. Practical and easy-to-understand information about Go memory metrics is hard to come by, so it’s often challenging to reconcile your system metrics—such as process resident set size (RSS)—with the metrics provided by the old runtime.MemStats, with the newer runtime/metrics, or with profiling data.

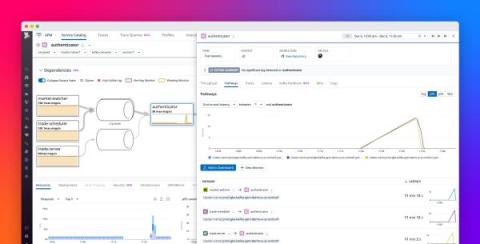
Troubleshoot streaming data pipelines directly from APM with Datadog Data Streams Monitoring

When monitoring applications with streaming data pipelines, there are additional complexities to consider that are not present in traditional batch-processing systems. Whether you’re using streaming data pipelines to power a digital trading platform, capture sensor data from an IoT device, or recommend news articles to users, it can be challenging to identify the root cause of delays when you’re dealing with distributed systems, real-time data, and the dynamic nature of events.

Streamline Azure container monitoring with the Datadog AKS cluster extension

Azure Kubernetes Service (AKS) enables you to easily deploy and manage containerized applications in Azure while leveraging Microsoft resources such as development tools, security features, and more. As with any Kubernetes service, the sheer volume of containers being orchestrated makes monitoring AKS cluster health challenging, which can slow response times to critical incidents and create bottlenecks around long-term optimizations.

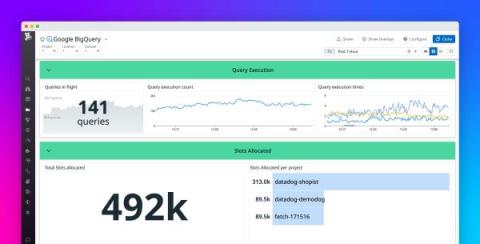
Monitor BigQuery with Datadog

BigQuery is Google Cloud Platform’s fully managed serverless data warehouse. It enables data analysis and storage at petabyte scale while eliminating the overhead of managing infrastructure. As a managed service, BigQuery autoscales and provisions compute resources and storage as needed, helping you reduce the overhead of managing infrastructure but also reducing your visibility into performance. And BigQuery users face other challenges when it comes to visibility.

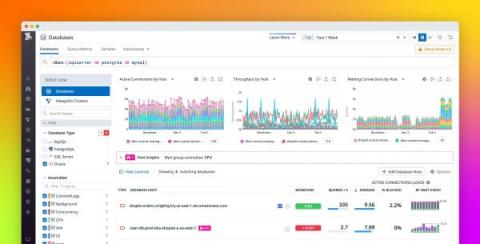
Monitor Oracle managed databases with Datadog DBM

Datadog Database Monitoring (DBM), which provides host-level and query performance metrics and insights for PostgreSQL, MySQL, and SQL Server, is now available for Oracle. Oracle is one of the most common database types, and now teams that operate Oracle databases can use Datadog to monitor these resources alongside telemetry from across their environments.

Datadog on Design Systems

Over the last five years, the Datadog platform has grown. We added Application Performance Monitoring to complement our core infrastructure monitoring product, Log Management, Synthetic and Real User Monitoring, and more. For an enterprise software platform to be successful, the whole has to be greater than the sum of its parts. In Datadog’s case, this means users must be able to connect different types of data, pivot seamlessly from one context to another, and follow the thread of an investigation wherever it might lead.