Operations | Monitoring | ITSM | DevOps | Cloud

Datadog

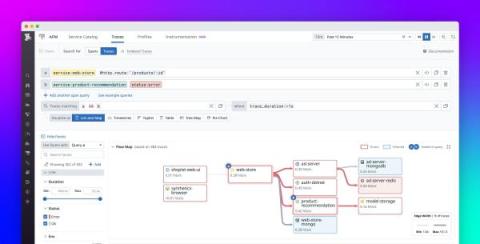
Analyze the root causes and business impact of production issues with Trace Queries

Tracing provides indispensable insights into the state and performance of distributed applications, but it can often be difficult to determine the root cause or ultimate business impact of issues indicated by traces. Translating visibility of individual microservices into broader performance insights often requires drawing complex correlations between spans. This can be a laborious process, which can complicate everything from troubleshooting and triage to tracking KPIs and managing costs.

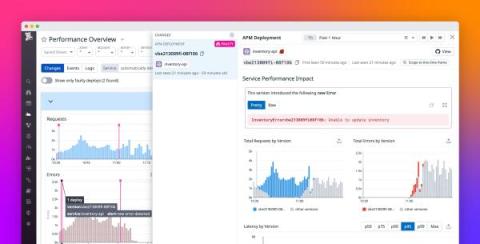
Quickly spot and revert faulty deployments with Change Overlays

Faulty deployments and other types of erroneous changes may account for around 70% of all application outages. With the prevalence of CI/CD workflows, engineering teams make changes to their applications, services, and infrastructure all the time, which can make it difficult to trace issues to specific changes.

Datadog on Kubernetes Autoscaling

Datadog, the observability platform used by thousands of companies, runs on dozens of self-managed Kubernetes clusters in a multi-cloud environment, adding up to tens of thousands of nodes, or hundreds of thousands of pods. Also, this infrastructure is used by a wide variety of engineering teams at Datadog, with different features and capacity needs that may also change overtime.

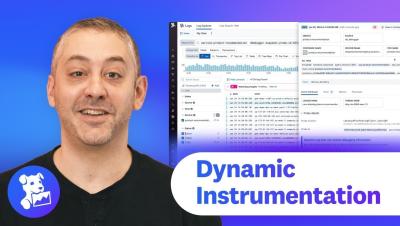
This Month in Datadog: Dynamic Instrumentation, Log Pipeline Scanner, Network Device map, and more

Datadog is constantly elevating the approach to cloud monitoring and security. This Month in Datadog updates you on our newest product features, announcements, resources, and events. This month, we put the Spotlight on Dynamic Instrumentation..

Monitor Windows Performance Counters with Datadog

The Windows operating system exposes metrics such as CPU, memory, and disk usage as built-in performance counters, which provide a unified way to observe performance, state, and other high-level facets of Windows subsystems, components, and native or third-party applications. As such, Windows Performance Counters can be invaluable for monitoring resource usage and the health of your infrastructure, as well as systems your services are using.

Track and alert on Amazon CloudWatch Network Monitor metrics with Datadog

Amazon CloudWatch Network Monitor, available as part of Amazon CloudWatch, is a network monitoring service that enables you to create customizable monitors for your network connectivity from AWS to on-premises infrastructure via AWS Direct Connect (DX).

Monitor your OpenStack components with Datadog

OpenStack is an open source cloud platform that enables customers to provision and manage compute, storage, and networking resources via web-based dashboards or APIs. OpenStack offers a range of services beyond standard infrastructure-as-a-service functionality, including orchestration, fault management, and service management components. These components help customers build, maintain, and scale high-availability applications.

How Autodesk engineers better service and own their infrastructure.

Morgan Goose, Autodesk, shares how he and his team have democratized observability and made it a default offering for all their engineers. Autodesk is a global leader in software for people who design and make the world. That includes software for architects, builders, engineers, 3D artists, and production teams. To ensure the best customer experience, Autodesk has partnered with Datadog and is taking advantage of products like DBM to quickly identify and maintain the systems they instrument.