Operations | Monitoring | ITSM | DevOps | Cloud

Datadog

How Complyt used Datadog's Cloud Cost Management to reduce their cloud spend

Learn how the team at Complyt was able to integrate Cloud Cost Managament in a matter of hours and quickly pinpoint underutilized services to cut their cloud spend in half. CCM delivers cost data where engineers work and with resource-level context like CPU, memory, and requests — easily scoped to their services and applications — so that they can take action and spend effectively.

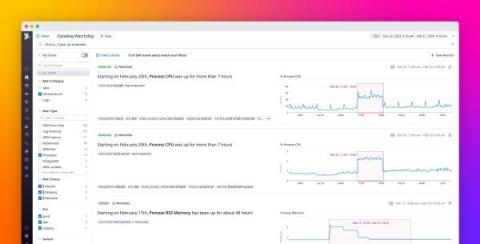
Troubleshoot anomalies in workload performance with Watchdog Insights and Alerts for Live Processes

Processes—the service workloads that run on your infrastructure—are the building blocks of your application, and it’s critical to know how well they operate at every level of the stack. Degraded process performance can lead to downtime for your mission-critical services, resulting in loss of customer trust and potentially impacting revenue for the business.

How to monitor etcd with Datadog

So far in this series, we’ve walked through key etcd metrics and tools you can use to monitor etcd metrics and logs. In this post, we’ll show you how you can monitor etcd with Datadog, including how to: But first, we’ll show you how to set up and configure the Datadog Agent and Cluster Agent to send etcd monitoring data to your Datadog account.

Tools for collecting etcd metrics and logs

In Part 1 of this series, we looked at how etcd works and the role it plays in managing the state of a Kubernetes cluster. We also explored key etcd metrics you should monitor to ensure the health and performance of your etcd cluster. In this post, we’ll show you how you can use tools like Prometheus, Grafana, and etcdctl to collect and visualize etcd metrics. We’ll also show you how to collect etcd logs that provide context for those metrics.

Key metrics for monitoring etcd

Etcd is a distributed key-value data store that provides highly available, durable storage for distributed applications. In Kubernetes, etcd functions as part of the control plane, storing data about the actual and desired state of the resources in a cluster. Kubernetes controllers use etcd’s data to reconcile the cluster’s actual state to its desired state. This series focuses on monitoring etcd in Kubernetes.

Monitor the Windows Registry with Datadog

The Windows Registry is a centralized key-value database that stores permissions, user data, and configuration settings for the Windows operating system and many Windows native applications. The keys stored in the registry provide a granular view into the processes occurring on a Windows host, such as certificate expirations, security checks, and pending reboots.

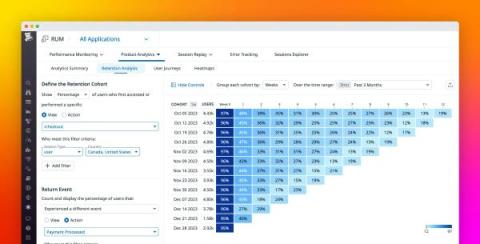
Measure long-term user engagement with Datadog Retention Analysis

It’s relatively easy to study the immediate impact of new releases by analyzing short-term changes in user behavior or system activity. However, this information doesn’t tell you much about the long-term viability of your application, which depends less on the novelty of major application updates and more on sustained usability.

Why ngrok Prioritized a Datadog Integration for Streamlined Monitoring of HTTP Events

ngrok delivers instant ingress to your applications in any cloud, private network, or devices with authentication, load balancing, and other critical controls using their global points of presence. Hear from Chad Tindel, Field CTO & VP WW Solution Architecture, on why Datadog was their most requested integration and how it provides an easy pathway to ship application and traffic logs into one unified observability platform.

Datadog Conversations: Toyota's Shift to Software-First Mobility

As the world’s largest automotive manufacturer and the leading software-first mobility company, Toyota leans on Datadog to achieve its goals of delivering value to customers and uplifting employees with new technologies and processes. Jason Ballard, IT Executive and General Manager, shares his top priorities for the enterprise in North America and offers his advice for how other leaders in the industry can transform their business.

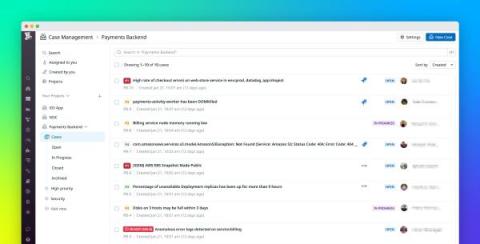
Centralize, triage, and track tickets with Datadog Case Management

Complex systems require many different monitors to assess the health of their infrastructure and applications, creating a wealth of alerts that can be hard to track. Due to a lack of effective triage processes, many organizations page engineers for every alert that comes in, making it difficult to separate false positives from issues that actually require immediate attention.