Operations | Monitoring | ITSM | DevOps | Cloud

%term

LogicMonitor is recognized as a 2024 Customers' Choice for Observability Platforms on Gartner Peer Insights

LogicMonitor is pleased to have been recognized as a Customers’ Choice vendor for 2024 in the Observability Platforms category on Gartner Peer Insights. This distinction is based on feedback and ratings as of December 30, 2024. LogicMonitor reviewers gave us a 4.7 (out of 5) overall rating in the report, with 94% saying they would recommend the LogicMonitor platform and 83% coming from companies with over $50 million in revenue based on 49 reviews submitted as of October 2024.

Using SolarWinds Loggly to Get the Most Out of MongoDB Structured Logging

Logs are essential for understanding and optimizing performance, and MongoDB structured logging makes them more powerful. By organizing logs into a consistent format, we can query and analyze them more efficiently. However, dealing with logs locally has its limits. That’s where a centralized log management tool like SolarWinds Loggly comes in. Shipping MongoDB logs to SolarWinds Loggly gives you a unified view of your data, advanced analytics, and proactive monitoring.

How to Fix Poor AWS Latency

Find out how to reduce your latency and get better network performance from the leading cloud service provider. In the modern business world, AWS is everywhere. According to HG Insights, the leading hyperscaler has over 50% market share, with 2.38 million businesses worldwide using AWS cloud services in 2024. One of the top questions we hear AWS users ask is how they can make their AWS connection faster.

NIST 800-53: Understanding the Rosetta Stone of security frameworks

Across various industries including the Department of Defense (DoD), federal service agencies, financial institutions, healthcare and other highly regulated organizations, the National Institute of Standards and Technologies (NIST) 800 53 security framework, is used to describe the security compliance. It is a standard catalog of security controls for protecting organizations’ operations, assets, and users from cyber threats. To be sure that is a broad definition that requires more nuance.

Introducing CloudWatch Metric Stream Support in Lumigo

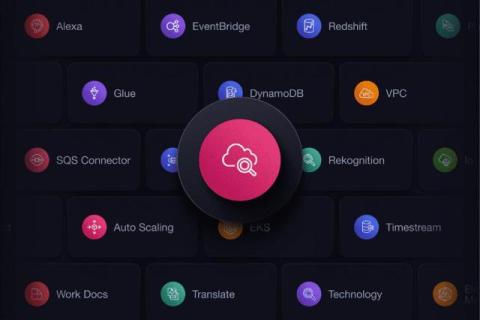
At Lumigo, we are constantly working to help you gain full visibility into your AWS environments with minimal friction. That’s why we’re excited to announce our support for CloudWatch Metric Stream. Now, AWS users can easily send their CloudWatch metrics to Lumigo to create dashboards, set alerts, and unify all their observability data—traces, logs, and metrics—into one powerful, centralized view.

Transformative Assessments in Tidal Accelerator

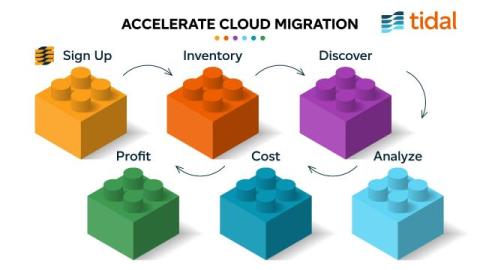
Cloud migrations can be complex, but they don’t have to be overwhelming. With the Tidal Accelerator platform, we’ve simplified the process, enabling organizations to not only migrate to the cloud efficiently by embracing the full spectrum of cloud migration methods, but also plan for a modernized infrastructure that supports long-term success. Here’s how Tidal Accelerator makes it possible.

Kickstart your investigations and reduce alert noise with Doctor Droid's offering in the Datadog Marketplace

Being an on-call engineer is often overwhelming, requiring you to pivot between tickets, dashboards, runbooks, and different data sources as you try to separate legitimate incidents from unnecessary noise. Not only does the process of investigating irrelevant alerts take time away from remediating important issues, but it also compounds alert fatigue.

The three pillars of observability

Do you feel you’re always playing catch-up with incidents? If so, you’re not alone. As IT environments become more complex, alerts keep piling up, and finding the root cause feels like searching for a needle in a haystack. And ITOps and incident responders are left scratching their heads and wondering: what went wrong? It can be frustrating when you don’t have end-to-end visibility into your systems. This is where observability comes in.