Operations | Monitoring | ITSM | DevOps | Cloud
%term
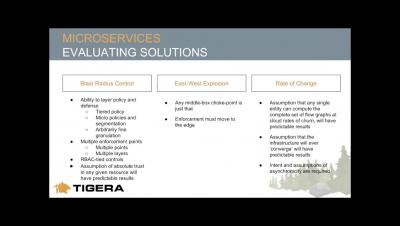
Microservices Security Summer Camp Series 2 - Best Practices for Securing Infrastructure
Microservices Security Summer Camp Session 1 - Intro to Security for Microservices
Mattermost at DevOpsCon Berlin | What is ChatOps?
Guest Blog Post: Ballerina Makeover with Grafana
In this guest blog post from the folks at Ballerina, Anjana shows you how you can easily visualize metrics from a Ballerina service with Grafana, walking you step by step through the installation and configuration of the components. They’ve also extended an offer for a free ticket to their upcoming Ballerinacon to the Grafana community.
Zipkin vs Jaeger: Getting Started With Tracing
Request tracing is the ultimate insight tool. Request tracing tracks operations inside and across different systems. Practically speaking, this allows engineers to see the how long an operation took in a web server, database, application code, or entirely different systems, all presented along a timeline. Request tracing is especially valuable in distributed systems where a single transaction (such as “create an account”) spans multiple systems.
Goliath Performance Monitor For Hospitals Using Epic
Runtime container security - How to implement open source container security (part 1).
Container security is top-of-mind for any organization adopting Docker and Kubernetes, and this open source security guide is a comprehensive resource for anyone who wants to learn how to implement a complete open source container security stack for Docker and Kubernetes.
Week of 7.9: What's New in Product
Announcing the following new integrations: Microsoft Active Directory, Statusy
Exception Perceptions: Everything is Cool When You're Part of a Team
Welcome, and thanks for joining us! Today on Exception Perceptions, we’re inviting Sentry Product Manager Sara Gilford to give us all the dirt on collaboration and ownership. That’s right; we’re uncovering the juicy details of who and how folks on teams within Sentry should be notified when issues pop up in their application.


