Operations | Monitoring | ITSM | DevOps | Cloud

LogicMonitor

Financial Services Customer Maintains 99.99% Uptime With LogicMonitor

In this case study video, LogicMonitor is joined by Abrigo, a software company for financial institutions, to discuss the evolution of the financial technology space through the digital transformation era. From supporting PPP loans throughout the pandemic to consolidating a plethora of monitoring tools into one platform for greater visibility and ease of use – LogicMonitor provides Abrigo with the enterprise-grade SaaS monitoring solution it needs to support its customers 24/7, around the globe.

GCISD Accelerates Digital Transformation With LogicMonitor

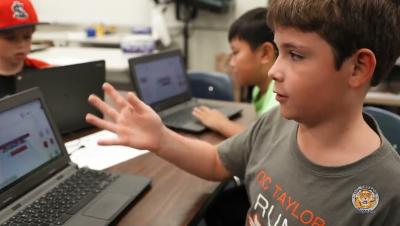
In this case study video, LogicMonitor is joined by Grapevine-Colleyville Independent School District to discuss the evolution of the education space through the digital transformation era. From keeping tabs on thousands of devices, consolidating a plethora of monitoring tools into one platform for greater visibility and ease of use, and leveraging AI powered alerting and forecasting, LogicMonitor provides GCISD with the enterprise-grade SaaS monitoring solution it needs to support its students 24/7, wherever they are learning.

Difference Between Public, Private, and Hybrid Cloud

Cloud computing is vast. It encompasses a huge range of architectural styles, classifications, and types. This complex computing network has transformed the way we work and is a crucial part of our daily lives, both at home and at work. For organizations, there are many ways to “cloud”, but let’s start with the basics of cloud computing; the internet cloud.

Uptime vs. Availability

Unlike physical stores and organizations that operate during set hours, the IT world never sleeps. In today’s highly connected digital environment, many believe that when an investment is made in technology, it should be accessible at all times — which is virtually impossible to guarantee. Since disruptions occur, organizations should evaluate the services needed to run operations smoothly. For example, what services are required during an IT service outage to ensure minimal disruptions?

Docker Logging: How Do Logs Work With Docker Containers?

Docker containers are a great way to create lightweight, portable, and self-contained application environments. Logging is critical for every application since it gives valuable information for troubleshooting, evaluating performance issues, and drawing an overall picture of the behavior of your architecture. This article presents a thorough tutorial covering all you need to know to start with Docker logging. It also provides some recommended practices for optimizing the logs of your containerized apps.

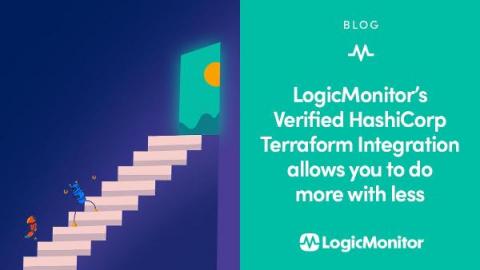
LogicMonitor's Verified HashiCorp Terraform Integration Allows You To Do More With Less

Here at LogicMonitor, we’re really big on extensibility and automation. We’re constantly adding to our catalog of monitoring coverage and ensuring that setup is as simple as possible. We also monitor almost any data you can expose on a network. People have done way more with LogicMonitor than we would have ever imagined, and I’m extremely excited to announce our next step in that commitment to extensibility and automation.

Ruby Application Manual Instrumentation for Distributed Traces

OpenTelemetry is a project by the Cloud Native Computing Foundation aimed to standardize the way that application telemetry data is recorded and utilized by platforms downstream. This application trace data can be valuable for application owners to understand the relationship between the components and services in their code, the request volume and latency introduced in each step, and ultimately where the bottlenecks are that are resulting in poor user experience.

Flask Application Manual Instrumentation for Distributed Traces

In this blog series, we share the application instrumentation steps for distributed tracing with OpenTelemetry standards across multiple languages. Earlier, we covered Java Application Manual Instrumentation for Distributed Traces, Golang Application Instrumentation for Distributed Traces, Node JS Application for Distributed Traces, and DotNet Application Instrumentation for Distributed Traces. In this blog post, we are going to cover.

LogicMonitor launches Santa Tracker Dashboard to monitor annual Christmas flight

A pillar of the December holiday season, the Elves at Santa’s Workshop work tirelessly year-round to provide a quality Christmas experience for children around the world who have made it to the Nice list. To ensure all children on the Nice list receive their Christmas packages in a timely manner, the IT team at Santa’s Workshop turned to LogicMonitor to monitor Santa’s annual journey around the globe in real-time.

Perfecting the Customer Onboarding Experience for MSPs

Onboarding is an in-depth process that sets the stage for relationships with Managed Service Providers (MSPs) and their customers. Perfecting the onboarding experience will give customers the confidence that choosing an MSP to manage their IT was, and is the best choice. A poor first impression can damage credibility, so it’s vital to have a solid plan in place.