Operations | Monitoring | ITSM | DevOps | Cloud

%term

An Overview of the OpenTelemetry Collector's Configuration File

In this video, I’ll provide an overview of the OpenTelemetry Collector’s configuration file (config.yaml) with examples from the Splunk distribution. I will briefly explain the components of the Splunk OTel Collector, and walk you through a sample generic configuration of the OTel Collector. We’ll then use the Splunk Observability Cloud interface to construct the commands needed to install the Splunk OTel Collector on a specific host. This installation will copy a default Splunk OTel Collector configuration onto the host, and we’ll review the Splunk specific components of this configuration.

How to Send Prometheus Metrics to Grafana Cloud Using Alloy | Ask the Experts | Grafana

"How do I push metrics using Grafana Alloy?" William Dumont from the Grafana Alloy team answers the question by showing you how to collect Prometheus metrics and forward them to Grafana Cloud using Grafana Alloy. This video is just a preview of what you can expect from our Ask the Experts booth at ObservabilityCON and GrafanaCON. The Grafanistas behind our solutions, features, and the LGTM Stack can provide answers to your toughest questions on the spot.

The 80/20 Rule of Bug Fixing

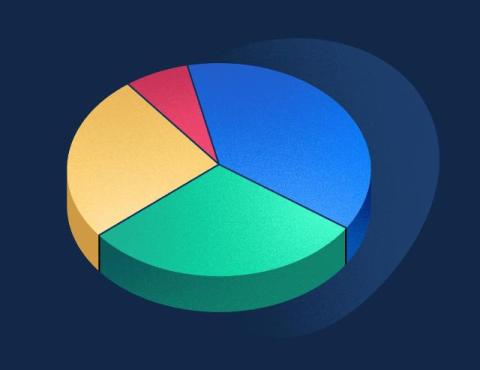
At BugSplat, we've been supporting applications and video games with crash and error reporting for a long time. Over the years, we've collaborated with a wide range of teams, handling applications of all sizes. From our experience and numerous conversations with users, we've noticed an interesting trend: the distribution of crashes isn't uniform. If your application experiences 100 crashes in a given version, those crashes aren't caused by 100 different defects.

Prometheus data source update: Redefining our big tent philosophy

As we continue adding to our growing catalog of more than 100 plugins for Grafana, we have been focused on developing data sources for Grafana that are more purpose-built for the respective technologies. One example has been the recent update to our core Prometheus data source. We have deprecated AWS authentication from the original Prometheus data source, and we created a new dedicated Amazon Managed Service for Prometheus plugin that will specifically cater to the AWS use case.

Developer's Guide to Getting Started with Pandas Profiling

Exploratory data analysis is a key component of the machine learning pipeline that helps in understanding various aspects of a dataset. For example, you can learn about statistical properties, types of data, the presence of null values, the correlation among different variables, etc. But to get these details, you need to use different types of Python methods and write multiple lines of code.

Balancing Centralization and Autonomy: The Key to Automation at Scale

The recent global outage reminds us that identifying issues and their impact radius is just the first part of a lengthy process to remediation. Incidents are inevitable; how we prepare for and learn from them is what sets teams up to respond more effectively next time. As we saw from the remediation steps taken by enterprises around the world, implementing a known fix across a large number of environments that are potentially managed by a number of distributed teams can be a gargantuan challenge.

Alerting with Twilio: Connect Your Monitoring with the Top-1 Communications Platform

You might be surprised. Why does ilert, the platform dedicated to alerting and incident management, publish anything about the direct (in the sense of bypassing an incident management tool) connection between monitoring solutions and Twilio? Do they take the bread out their own month? —You might think. Working on DevOps incident management since 2009, we believe every solution fits specific needs.

The risks - and rewards - of using production data for testing

Data, and the way enterprises use data in areas like development and testing, has not traditionally been a focus for business leaders but that’s now changing. Data is more varied and complicated than ever before, for example, with enterprises using two or more different database platforms – and 40% using four or more. It’s also spread wider and further, with enterprises hosting their databases in a combination of cloud and on-premises infrastructures.