Operations | Monitoring | ITSM | DevOps | Cloud

%term

From black box magic to automation transparency

The CFEngine policy analyzer is an awesome new service introduced in CFEngine 3.13. The policy analyzer allows you to quickly debug policies and inspect what is going on under hood of CFEngine. A known challenge with CFEngine, and most DSL based automation tools, relates to understanding what is actually going on during live operations. Many users view it as “black-box magic”. Unfortunately, the amount of magic and the size of the black box increases with the level of automation.

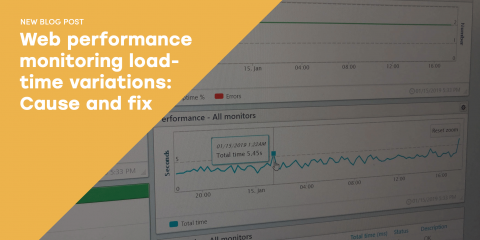
Web performance monitoring load-time variations: Causes & fix

When looking at the performance of your website, web service,or API over a span of time, you will notice variations in the performance reported by the monitor. You may also notice inconsistencies between the performance reported from different monitors. Why? Why do you see spikes in your charts?

Toward Holistic Visibility: Gartner's Key Trends to Watch in IT Infrastructure Monitoring

It has been clear to many IT practitioners for a while now that the fundamental nature of IT infrastructure monitoring is transforming, right alongside the rest of the IT landscape. Gartner’s latest Market Guide for IT Infrastructure Monitoring Tools does a great job of mapping out evolving trends in the space.

SolarWinds Cloud Monitoring for DevOps

SolarWinds cloud monitoring portfolio—which includes Pingdom®, AppOptics™, Papertrail™ and Loggly®—helps DevOps professionals identify and troubleshoot problems quickly and easily. These purpose-built tools help provide full-stack visibility from user experience to custom metrics, distributed traces, and log management.