Operations | Monitoring | ITSM | DevOps | Cloud
%term
How to migrate SNMP monitoring from Cacti to Pandora FMS
Icinga 2.10 released: Namespaces, Notifications, TLS Performance
Our friends from the Max-Planck-Institut for Marine Mikrobiologie kindly sponsored that acknowledgement notifications are now sent only to users which have been notified about a problem before – thanks a lot. Another sponsor asked for more child options for the ScheduledDowntime which are now released in 2.10.
Power to the People: Control Your Own Trigger Destiny with Webhooks
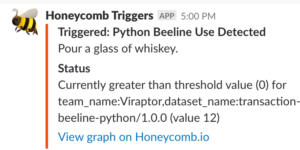
When we release something new, whether it’s a new SDK or Beeline or a new feature in the UI, we’ll often set a Honeycomb Trigger to keep track of its use. Sometimes we don’t necessarily have a customer we know is immediately going to use the feature in question, and we’re interested in when it happens.
Cloud Performance Monitoring Solutions
Grant Glading, Head of Sales and Marketing at Interlink Software, on moving to the cloud without losing visibility of performance and service health.
Psychological Theories Behind Agile Software Development
With an almost 20-year career in social services—including working in institutions such as The University of Chicago, the United States Peace Corps, Chicago public schools, Child Protective Services, the Catholic Church, and for the U.S. federal government in probation and parole programs—my leap into Silicon Valley was as much a culture shock as the 2.5 years I lived in the Andes Mountains of Ecuador.
Must-Have Features Of Every Effective Website
Every reliable web development company understands that the website of a company has a direct impact on the company’s business either positively or negatively. So, it is your duty to engage your web development company on ways by which your website will boost your lead generation and conversion rate. On that note, here are some of the features your web development company must include in the design and development of your website.
Grafana v5.3 Released
Grafana v5.3 brings new features, many enhancements and bug fixes. This article will detail the major new features and enhancements.
Pivotal Cloud Foundry Monitoring with Datadog
In part three of this series, we showed you a number of methods and tools for accessing key metrics and logs from a Pivotal Cloud Foundry deployment. Some of these tools help PCF operators monitor the health and performance of the cluster, whereas others allow developers to view metrics, logs, and performance data from their applications running on the cluster.
Collecting Pivotal Cloud Foundry logs and metrics
So far in this series we’ve explored Pivotal Cloud Foundry’s architecture and looked at some of the most important metrics for monitoring each PCF component. In this post, we’ll show you how you can view these metrics, as well as application and system logs, in order to monitor your PCF cluster and the applications running on it.


