Alerting with Grafana and InfluxDB Cloud
Learn from InfluxDB experts - Learn about alerting with Grafana and InfluxDB Cloud. Feel free to ask questions!


In the data business, we often refer to the series of steps or processes used to collect, transform, and analyze data as “pipelines.” As a data scientist, I find this analogy fitting, as my concerns around data closely mirror those most people have with water: Where is it coming from? What’s in it? How can we optimize its quality, quantity, and pressure for its intended use? And, crucially, is it leaking anywhere?
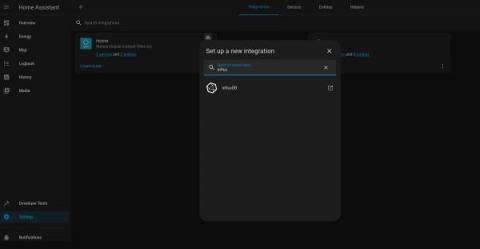
This post covers how to get started with Home Assistant and Grafana, including setting up InfluxDB and Grafana with Docker, configuring InfluxDB to receive data from Home Assistant, and creating a Grafana dashboard to visualize your data. It provides a comprehensive guide for real-time monitoring and analysis of Home Assistant data. In this tutorial, you’ll learn how to integrate Grafana with Home Assistant using InfluxDB.
This post was written by Siddhant Varma. Scroll down for the author’s bio. Observability is an essential aspect of a healthy software architecture and a highly performant system. It enables developers and engineers to understand and dive deeper into how their application behaves. This in turn helps them monitor it effectively.
Missed our latest webinar on FinOps for MSPs? We’ve got you covered! This blog post will cover what the FinOps experts discussed and the main things to remember. FinOps are revolutionizing MSP operations by adding a data-driven approach to cost management. This method helps MSPs optimize their cloud usage, provide white-glove support to customers, and give visibility on their expenses.