Operations | Monitoring | ITSM | DevOps | Cloud
Analytics
5 good questions to ask before migrating your database (and answers too)
Cyclical Statistical Forecasts and Anomalies - Part 6
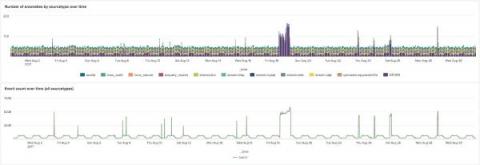
At this point we are well past the third installment of the trilogy, and at the end of the second installment of trilogies. You might be wondering if the second set of trilogies was strictly necessary (we’re looking at you, Star Wars) or a great idea (well done, Lord of the Rings, nice compliment to the books). Needless to say, detecting anomalies in data remains as important to our customers as it was back at the start of 2018 when the first installment of this series was released.
Data Lake vs Data Warehouse: What's the Difference?
Setting up Django to use Aiven for PostgreSQL
Time Saved Monitoring Deployments Is Time Spent Building Better Products
Bigeye is the data observability platform that teams at companies like Zoom and Instacart use to keep their data pipeline fresh, high quality, and reliable. Their customers depend on them to detect problems in their data pipelines 24/7 and to keep data reliable enough for production use cases of analytics and machine learning. In this environment, margins for error are razor thin and waiting for a user to let you know that something isn’t working means it’s already too late.
Up the Creek Without a Paddle: Easing the Strain on Your Analytics Systems
When it comes to your analytics tools, would you say they’re getting easier to manage overall, or is it increasingly difficult? Can you easily scale to meet new compliance requirements, or is there so much custom work required that the pace of change is too much for your team to handle? Do you feel in control over how and where your observability data flows, or do you feel beholden to your vendors? This blog post will shed light on how you can ease the strain on your downstream systems.
TL;DR InfluxDB Tech Tips: Handling JSON Objects and Mapping Through Arrays
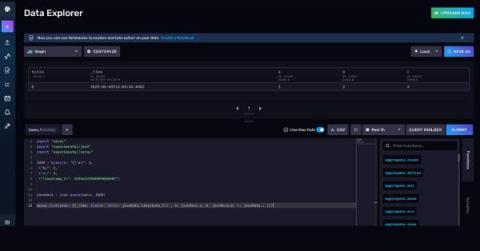
There are multiple ways to use Flux to bring in data from a variety of different sources including SQL databases, other InfluxDB Cloud Accounts, Annotated CSV from a URL, and JSON. However, previously you could only manually construct tables from a JSON object with Flux as described in this first example. We’ll describe how to work with three examples with increasingly complex JSON types. First we will describe how to work with these JSON types with metasyntactic examples.
The Power Of The Ecosystem: Intel and Splunk Help Partners Bring Data To Life
Last year, International Data Corporation released its Data GlobalSphere Forecast, 2021-25, in which it outlined the projected 23% compound annual growth in data, leaping to 175 zettabytes of data globally. So the natural question becomes, what will the world do with that much data? And, more importantly, what can your business do with your data?
Five worthy reads: Be doubtless of your decisions with decision intelligence
Five worthy reads is a regular column on five noteworthy items we’ve discovered while researching trending and timeless topics. In this edition, we’ll learn what decision intelligence is, how it could help businesses, and much more. Illustrated by Derrick Roy We covered the basics of decision intelligence (DI) in an earlier Five worthy reads blog. In this blog, we’ll take a look at how it is going to help businesses flourish in 2022.


