Operations | Monitoring | ITSM | DevOps | Cloud
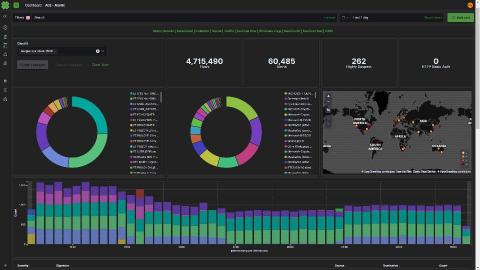
Léargas Security chooses Elastic, drops Splunk to battle COVID-19 fraud
Léargas Security (Léargas is Gaelic for “insight”) provides clients with actionable insights into anomalous or abstract behaviors through the correlation of data gathered from converged security controls: cyber and physical.
Independent Survey Reveals: Continuous Intelligence Demand Grows as Organizations Shift to Real-time Business
Gaining Visibility and Control Over Solar Energy Storage Devices Using InfluxDB Cloud
Energy storage and sustainability are big issues in Hawaii, where oil tankers are shipped in everyday, just to keep the lights on. Resiliency in the energy grid, due to threat of natural disaster, is critical. Energy storage is needed to manage how much solar energy is coming into the market or into the grid. Properly managing the power entering the grid is vital for grid stability since Hawaii has intermittent energy that floods the grid.
What's New in Elasticsearch 7.7?
Elastic is prepping for Elasticsearch 8.0, but in the meantime is rolling out upgrades and features with Elasticsearch 7.7. The new version introduces asynchronous search as well as changes with Elasticsearch clusters, mapping, SQL enhancements, snapshots and machine learning. This post will cover just a few of the highlights of the new release. Besides asynchronous search, ES 7.7 also introduces multi-class classification, reduced heap usage, inference time features, and better password security.
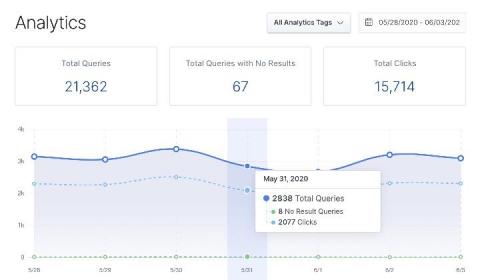
What your Elastic App Search analytics are telling you
At Elastic, we love data. It’s the backbone of what we do: search. And that data takes many forms. A knowledge base article showing how to reset your cable box — data. Logs from your network — data. IP addresses accessing your secure network — data. A video tutorial on how adults can use TikTok — data. The list goes on. But behind each piece of data is a story. And a person. Or a customer.
Extending InfluxDB with Serverless Functions
Data ingestion and data analysis are the yin and yang of a time series platform. There are many resources to help you ingest data. Typical ingestions are agent-based, imports via CSVs, using client libraries, or via third-party technologies. Once your time series data arrives, analysis completes the circle and often leads to additional data collection, and so on and so forth.


