Operations | Monitoring | ITSM | DevOps | Cloud
Continuous Intelligence for Atlassian
Glitch List: March 2020
It has certainly been quite a month. With millions of workers forced to stay home due to COVID-19, or in some cases laid off altogether, the world’s networks have been under some unusual strains. Let’s see how that’s played out during this month in glitches.
What Is Anomaly Detection in Log File Analysis?
Logging is vital to the success of any IT project. With solid logging practice, you can troubleshoot errors, find patterns, calculate statistics, and communicate information easily. With the size and complexity of modern systems, performing these actions involves various analysis activities. One of these important analysis activities is anomaly detection. What is anomaly detection, and where does it fit in all of this? That’s what this post is about.
Glass Table Design: The Good, The Bad, The Ugly, and The Champion
Stop. Before you start adding KPIs to your brand new glass table, make sure you’ve done your homework on design principles.
Now's the Time to Perfect Your Customer Experience
As the COVID-19 outbreak progressively impacts the world, many companies are grappling with the strain. It’s a very uncertain time for business right now. Even with so many factors out of your control, but there are a few things you can do proactively to protect your business. Keep your customers happy. Do everything you can to provide the best customer experience and remedy leaks early.
How Road Traffic Insights Derived from Sensor Data Improve Public Safety and Reduce Emergency Services Response Times
It’s easy to see the value of sensor data that enables acting in time. Just picture driving as the scene of a massive traffic accident unfolds and ambulances race to the rescue…what a difference a few seconds can make. What if past traffic patterns could help city operators predict and manage traffic flow at critical times?
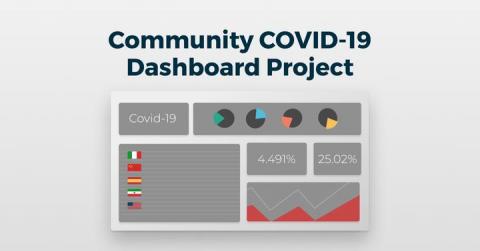
Launching the Community COVID-19 Dashboard Project
Let Data Shed Some Light in the Midst of Uncertainty The burden the COVID-19 novel coronavirus has placed on the world is enormous. There’s a great thirst for information and clarity. So, we at Logz.io have decided to offer a Community COVID-19 Dashboard Project, so that everyone can better understand how the outbreak impacts the world and their region. We see that as a community effort.


