Kubernetes Observability Demo - Sumo Logic
Modern, cross-functional site reliability and platform teams can’t afford to miss anything when solving a problem. Sumo Logic provides rich observability into Kubernetes environments.


Earlier today, LogDNA was named a Rising Star in connection with the Forbes 2019 Cloud 100 list. The list, which is published annually by Forbes in partnership with Bessemer Venture Partners and Salesforce Ventures, is their assessment of the top 100 private cloud companies in the world. Wow. It’s incredible to write that.
Elasticsearch is a powerful distributed search engine that has, over the years, grown into a more general-purpose NoSQL storage and analytics tool. The recent release of Elasticsearch 7 added many improvements to the way Elasticsearch works. It also formalized support for various applications including machine learning, security information and event management (SIEM), and maps, among others, through a revamped Kibana.
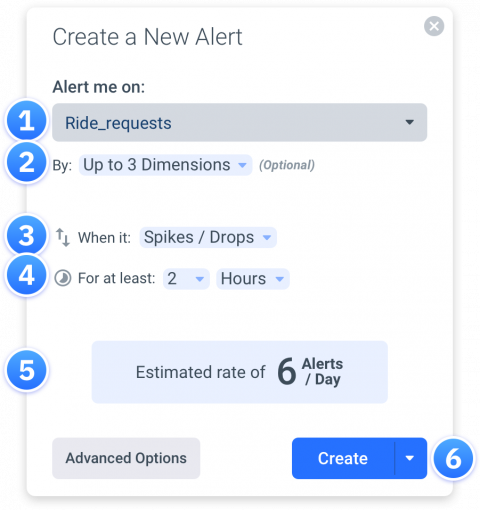
When you first set up your Anodot account, you create alerts on the KPIs that matter most to you. Advanced alert configurations enable you to define various parameters so that you only get alerts that are important to you: selecting the metric, building a query, grouping the data by dimensions, selecting triggers and conditions, choosing who and where it should be sent to, and so on.
With AI analytics slated as the biggest disruptor to big data and analytics, data leaders are quickly integrating this capability into their data strategy. Itzik Feldman, data engineering manager at Atlassian, the enterprise software company responsible for Jira and Trello, recently credited Anodot with helping keep the company’s 3,000 employees in touch with product performance and customer experience.
All engineering teams strive to build the best product they can as quickly as possible. Some, though, stumble into a false dichotomy of choosing between speed and quality. While that choice may have been necessary in the past, it’s not the case today. What I’d like to do in this article is explain why.
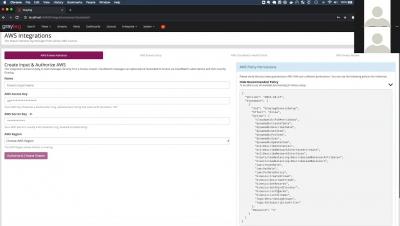
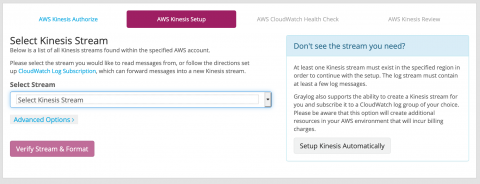
Today we are officially releasing Graylog v3.1.1 This release brings a whole new AWS Kinesis/CloudWatch Input to Graylog. The new input guides the user through the setup process and performs validation checks along the way. It also supports an automated CloudWatch Logs to Kinesis Streams setup, eliminating the complexity of manual setup.