Investing in a log analysis tool provides many benefits: it saves time needed to detect and troubleshoot a problem, reduces churn by providing a better user experience, and improves system security. There is a wide scope of use cases for log analysis - from tackling security and performance issues head-on to enhancing the quality of your services. What are some of the most common use cases for log file analysis?
LogDNA today announced a new offering that enables developers to troubleshoot coding bugs and quickly fix development errors in applications, potentially saving businesses millions of dollars in development hours, downtime and associated revenue loss. IBM Log Analysis with LogDNA integrates LogDNA services to allow developers to aggregate all their log data across applications in the IBM Cloud.
Elastic Stack 6.5 is out! Every new version of the Elastic Stack is packed with new features and updates, and as always, I’m happy to dive a bit deeper into the new release to provide our readers with a wrap up of what’s new. Interestingly enough, and as reflected in the announcements surrounding this release, this release is all about Kibana. That’s not to say the other components in the stack were left out – to the contrary, and I will cover them all, don’t you worry.
This blog miniseries talks about how to think about doing data analysis the Honeycomb way. In this episode, we announce an exciting new feature, currently in beta. Honestly, we’re so excited to get this out the door, we haven’t settled on a final name so for now, we’re going with “Codename: Drilldown.”
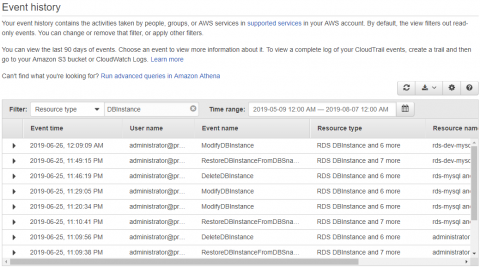
Today at Amazon Web Services (AWS) re:Invent we announced some new applications and integrations with popular AWS services, including the newly-released AWS Security Hub, AWS WAF and AWS Aurora for MySQL and PostgresSQL.
Website performance is a burning issue that matters to any IT professional who is responsible for the company’s website. Access logs performance analysis is used for analyzing all access logs for website performance: slow page load time, most frequent web pages and their errors, large web pages issues and more.
With an Access logs viewer, you can search and filter for specific messages, analyze them and improve your website performance and users experience.
We’re excited to announce the release of the Field Stats API plugin for Elasticsearch. The Field Stats API used to be present from Elasticsearch 1.6 to 5.6, to provide efficient statistics for fields of each index. For example, the minimum and maximum values of a date field.
Let’s face it, Kibana and Grafana were naturally meant to go together, right? They’re both great individually, but sparks really start to fly when they work together! Each has their own strengths but combined they cover all the monitoring and troubleshooting use cases you need. So what is keeping these two highly compatible technologies apart? Nothing. Anymore.