Operations | Monitoring | ITSM | DevOps | Cloud
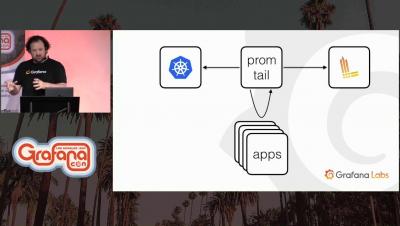
The Explore Workflow and Troubleshooting with Loki
Today's Challenges of Big Infra Monitoring
Why InfluxDB is Building Flux, a new scripting and query language
Business Leaders Can't Afford To Wait For Insights: How Self-Service BI is Changing Data Analysis
It doesn’t matter what industry you’re in — there’s more data at your fingertips than ever before. And with that data comes an opportunity to make informed decisions that will take your business to new heights. For marketing alone, becoming best-in-class at data analytics can help you generate 20 percent more revenue than your competitors. Those benefits increase exponentially when you bring data-driven decision-making to every aspect of your business.
Elasticsearch Mapping Exceptions - The complete guide
As Elasticsearch is gradually becoming the standard for textual data indexing (specifically log data) more companies struggle to scale their ELK stack. We decided to pick up the glove and create a series of posts to help you tackle the most common Elasticsearch performance and functional issues. This post will help you in understanding and solving one of the most frustrating Elasticsearch issues – Mapping exceptions.
5 Benefits to Run Elastic Stack in the Cloud
Elasticsearch, Logstash, and Kibana — the trio better known as Elastic Stack (or ELK, if you prefer a term that is now going out of style), make up a powerful set of tools for searching and analyzing data. Their power derives not just from their technical features, but also the fact that Elastic Stack is an open source platform that anyone can download and set up anywhere.
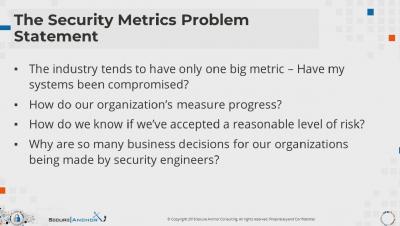
Cyber Security Metrics ft. Dr. Eric Cole
Elastic Stack Features (formerly X-Pack) Alternatives Comparison
Elastic Stack Features (formerly X-Pack) is an Elastic Stack extension that bundles security, alerting, monitoring, reporting, and graph capabilities. One could use either all or specific components.
BubbleUp Meets Tracing (and Other Odd-shaped Data)
A few weeks ago, BubbleUp came out of Beta. We’ve been getting fantastic user feedback on how BubbleUp helps users speed through the Core Analysis Loop and lets people find things they never could have found before. We’ve also been learning more about how BubbleUp works with Tracing, which unearthed some difficult issues. Today, we’re taking those head on.


