Operations | Monitoring | ITSM | DevOps | Cloud
Analytics
Overview of image similarity search in Elasticsearch
Imagine being able to mimic a celebrity’s look with a screenshot. Users could use the image to quickly find clothing sold online that matches the style. But, this is not the search experience of today. Customers struggle to find what they need, and if they can’t, they'll leave. Some of them don't remember the name (keyword) of what they are looking for, but have an idea of what it looks like or the actual image.
CDMs for Enterprise Data: Canonical Data Model Explained
E-Commerce and Log Management
As an e-commerce website owner you care about how your customers behave: why do they come to your website, which items or services are they most interested in, how much time do they spend on certain pages, and is their user experience above par? Also, it is very important to keep your website secure, as you can rest assured that no one wants to leave their payment details on an unsecured website.
One Technology That Makes Renewable Energy More Efficient
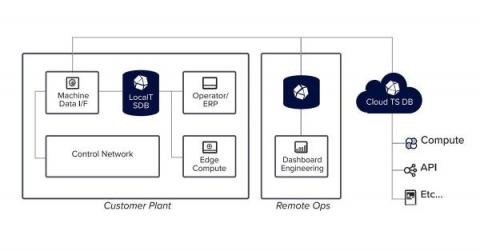
Time series data can provide insight into ways to make energy production and consumption more cost-effective and efficient. The year 2022 saw the impact that world events can have on global energy markets. The most drastic fluctuations affected fossil fuels, which led to greater discussion about the practicalities of renewable energy. Fortunately, the move toward increasing reliance on renewable energy remains a consistent trend.
Connect Apache Kafka to OpenSearch with Terraform
Amazon Kinesis Pricing Explained: A 2023 Guide To Kinesis Costs
Create your own data stream for Apache Kafka with Python and Faker
7 Best Practices for Data Visualization
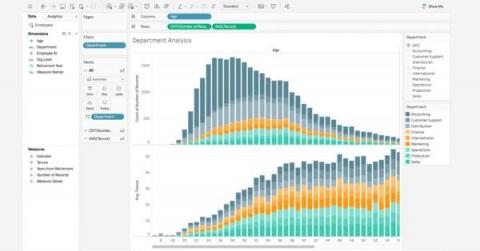
A look at best practices, no-code and low-code platforms you can use, common visualization types, criteria for good data visualization and more. Organizations regularly generate an overabundance of data that is essential for decision-making. Data visualizations play an important role in helping people understand complex data and observe patterns and trends over a period of time.


