At some point if you’re working with data, you’ll probably want to be able to visualize it with different types of charts and organize those charts with dashboards. You’ll also need somewhere to store that data so it can be queried efficiently. One of the most popular combinations for storing and visualizing time series data is Grafana and InfluxDB.
I recently chatted with one of our InfluxDB Cloud customers, Rune Labs, to discuss how they’re using this purpose-built time series platform. Every customer has a unique story — I love sharing their stories as well as their Telegraf, InfluxDB, and Flux tips and tricks. Keep reading to learn about Rune Labs’ approach to precision neurology, and learn from Engineering Manager Carolyn Ranti how they are using InfluxDB to collect sensor data.
With the release of InfluxDB’s new storage engine for InfluxDB Cloud, InfluxDB Cloud now supports SQL. This is because the updated InfluxDB uses the Apache Arrow DataFusion project as a key building block for its query execution engine. DataFusion’s sophisticated query optimizations support near unlimited cardinality data in InfluxDB Cloud.
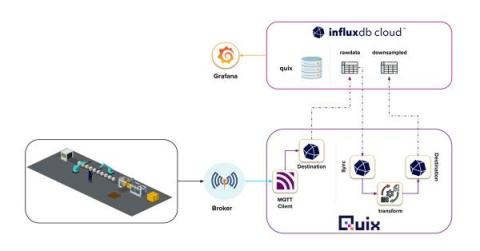
Continuing in our series of InfluxDays recaps, we turn our attention to Brian Gilmore’s presentation on Industrial IoT. This is an area that uses time series data extensively and has a lot of room to expand the way it uses this data. Here’s a quick breakdown of where things stand today.