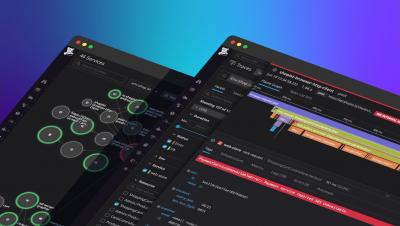
Moogsoft AIOps Live Demo with AppDynamics
A live demo of Moogsoft Enterprise AIOps and AppD working together, featuring the latest in Dynamic Topology from the recently released Moogsoft Enterprise 8.0.


The latest News and Information on Application Performance Monitoring and related technologies.
IT applications are vital for today’s digital economy and for the business to succeed, these applications must be highly available and performing well. Application performance degradations can occur for several reasons. There may be code-level issues, database slowness, or network bandwidth constraints. IT applications run on servers and if the server is not sized correctly or is under-performing, application performance will degrade as well.
In this video, we are going to take a look at what memory bloat is, and how you can use Scout to eliminate it from your applications. Memory related performance issues have the potential to bring your entire application down, and yet, most APMs completely ignore this fact and fail to provide any useful way of monitoring memory usage at all.
Application developers and application operations personnel are together responsible for ensuring that Java web applications perform well. In an earlier blog, we had discussed 7 configurations that Application Operations teams can use to make their Java applications high-performing. In this blog, we will focus on Application Developers and discuss 6 ways in which they can enhance the performance of their Java applications.
The promise of NoSample™ full-fidelity distributed tracing with unlimited cardinality exploration is that no application performance degradation will be sampled away. This ensures that executions, which exemplify problems related to latency and/or errors will be retained for further inspection and analysis. Additional value can be extracted from trace data by determining when such investigations should occur, in other words, by identifying spikes and anomalies in endpoint latency or error rate.