Operations | Monitoring | ITSM | DevOps | Cloud
The latest News and Information on Application Performance Monitoring and related technologies.
7 Configurations to Enhance the Performance of Your Java Web Applications
There has been a lingering perception that Java applications are slower than applications written in other languages. So, if performance is important for your application, you should not be considering Java as the programming language to use. This perception was true about 20 years ago, when Java was initially used for developing applications. In the early Java implementations, it took a long time for the Java Virtual Machine (JVM) to start.
Diagnose slow page requests with the latest addition to RUM
Why high-performing teams consolidate monitoring tools with Raygun APM
Datadog on Kubernetes
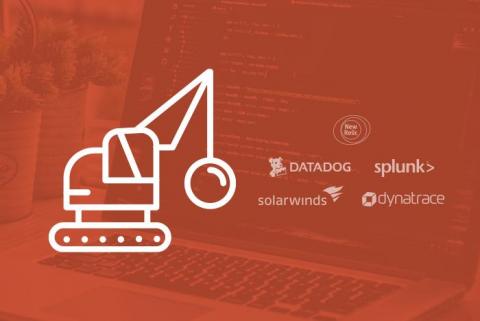
The $5B DevOps Stranglehold
Ten years ago NewRelic, DataDog, Splunk, Dynatrace and SolarWinds built tools we loved to use. They were easy to implement and solved problems quickly and efficiently. Each company was known primarily for a single, well-conceived product. NewRelic’s APM. Splunk’s log file analyzer. DataDog’s server monitor. SolarWinds’ network performance monitor. These companies were beloved by users during the 2000s. Fast forward to 2020 and the world is very different.
Datadog on Kafka
Citrix Admins can now track Citrix Connection Quality without Needing any Client Software
Citrix technologies are often used by remote employees or collaborators to access corporate applications and desktops. Citrix access is session oriented – a session is established at logon time and a connection between the client and the server/desktop being accessed is maintained for the duration of the session. User access to Citrix apps and desktops is highly interactive – mouse clicks, keystrokes, etc. all have to go from the client to the server/desktop to be processed.
Why Stack Trace APM Isn't Enough for Complete Web Application Monitoring
It’s probably true to say that if you asked an average user what makes a great web application, they’d probably say “speed.” But speed is the probably the least important aspect of an extensive rundown of elements. Factors like application development and rendering in the program are probably higher on that list. And what makes up a great performing application? And when something goes wrong, how do you know?


