Operations | Monitoring | ITSM | DevOps | Cloud

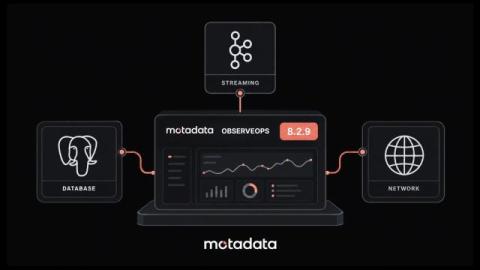
What's New in Motadata 8.2.9 as ObserveOps Expands Database, Streaming and Network Coverage

How often does a lagging replica or a bad network link reach users before your monitoring flags it? The problem grows when every layer has its own tool. Warning signs then show up in different places, often too late to act on. Motadata 8.2.9 came out on October 5, 2026, with eight updates to Motadata ObserveOps. Four of them focus on the network. The other four deal with databases, data streaming, alerting and SEBI compliance reporting. A few add support for technologies Motadata did not cover before.
DNS Monitoring: What to Track and Where to Watch It From

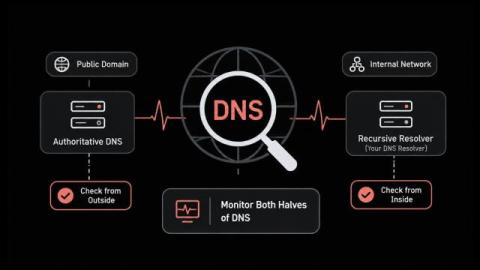
DNS monitoring asks your name servers the same question on a timer and checks the answer that comes back. Most teams aim it at their public domain and stop there. That covers half the problem. Your public domain and your internal resolver fail in different ways. A check from outside the building never sees the second one. In this blog, you'll see: By the end you'll know which half of your DNS nobody is watching. A DNS check sends a query and reads the reply. The reply can fail three ways.

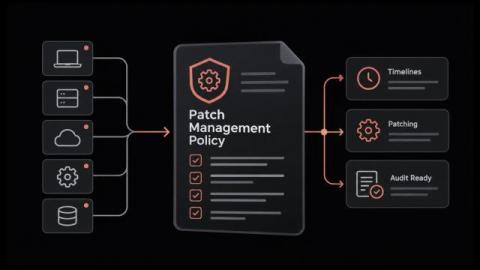
What a Patch Management Policy Should Contain to Keep Systems Secure and Audit-Ready

Who decides how fast a critical patch goes out, and who signs off when a production server can't be restarted? For many IT groups, the answer is a mix of one senior admin's judgment, an old ticket and a shared spreadsheet. It holds up fine right until an auditor asks for proof, or that admin leaves. A written policy replaces that guesswork with rules people have agreed to. Owners are named, deadlines are fixed, and there's a plan for the system that can't be patched on time.

Logging as a Service (LaaS): What It Costs and When It Fits

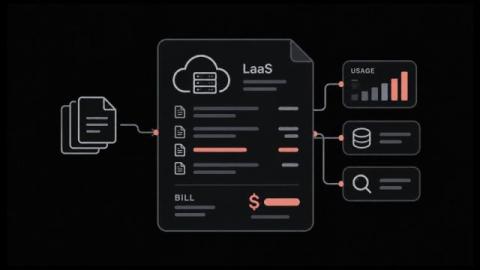
Logging as a Service moves your log management to a provider. They collect, parse, store and search your logs for a monthly fee. The fee is where it goes wrong. Providers meter five different things, and the one written into your contract decides whether ordinary growth doubles your bill. In this blog, you'll see: By the end you'll know which meter your workload lands on. Logging as a Service is a cloud-delivered model for collecting and searching logs.

WAN Link Monitoring for Faster Branch Troubleshooting

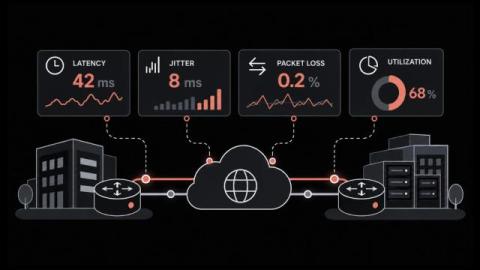
Why do users at a branch complain about choppy calls and stalled apps when every WAN circuit on the dashboard still shows up? A link can be reachable without being healthy. Delay and packet loss can rise for hours on a live circuit, and a simple up-or-down check will report nothing unusual the whole time. WAN link monitoring checks the quality of each site-to-site connection by having routers send their own test packets and time the replies.

What is End User Experience Monitoring (EUEM)? How It Relates to RUM and DEM

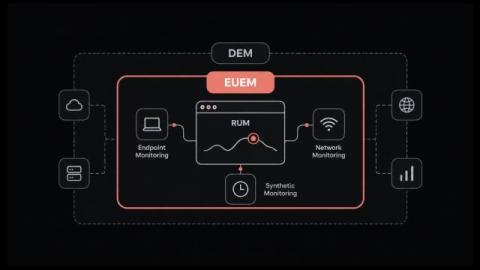
Why do tickets about a slow application keep arriving while every server, link and service check reports normal? That mismatch is the problem end user experience monitoring exists to solve. A healthy server is one thing, but the business notices something else: whether people can finish their work or complete a purchase without delays or errors. Monitoring in most IT operations groups was built to watch the systems from the inside, so it reports CPU load, memory and uptime.

How Alert Suppression Pauses Alerts During Planned Work Without Losing Visibility

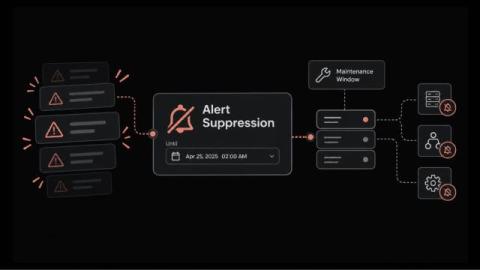
How many pages did your on-call engineer get during the last planned firmware upgrade on a core switch? The device stops responding and every dependent check fails. Soon the on-call phone is buzzing with alerts for a change that was approved last week. Alert suppression is a time-limited pause on alerts for a condition you already know about, such as planned work or an issue under investigation. And what is alert suppression from the engineer's side of the console?

RUM Metrics That Matter for User Experience and Revenue

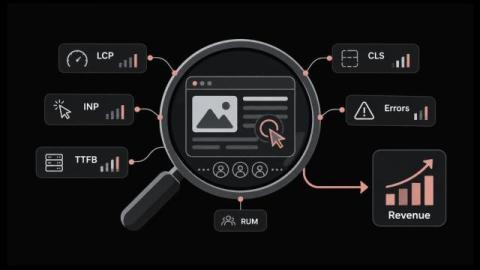
Why does a page that scores well in testing still draw complaints from customers about slowness? A lab test runs on one fast machine over a stable connection. Customers use older phones, congested mobile networks and browsers loaded with extensions, so their experience can only be measured on their own devices. Real user monitoring captures that experience, and it produces a long list of measurements.

SSL Handshake Guide Covering Each Step and the Fixes That Prevent Outages

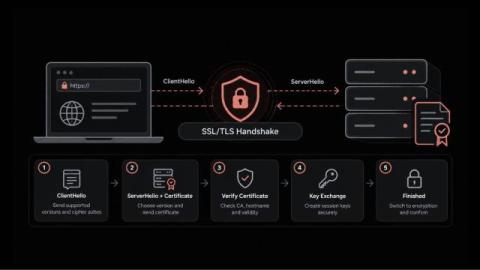
Why would a website that passes every uptime check still show customers a security warning? In most cases, the server is running and the network is healthy. The failure happens earlier, during the brief exchange in which the browser and the server agree on how to communicate securely. That moment is the SSL handshake. If it goes wrong, users get an error page while your dashboards stay green. Maybe a certificate expired; maybe a routine change left both sides on different protocol versions.

What Is RMM (Remote Monitoring and Management)?

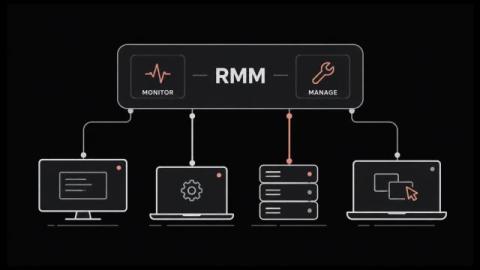
RMM lets one small team look after thousands of machines nobody will ever physically touch. It grew up inside managed service providers. The whole category runs on agent-based monitoring, which means a small program sits on every endpoint and phones home on a schedule. That agent is also why attackers have taken such an interest lately. In this blog, you'll see: By the end you'll know what the category covers and where it stops. RMM stands for remote monitoring and management.

7 Best SQL Server Monitoring Tools for 2026

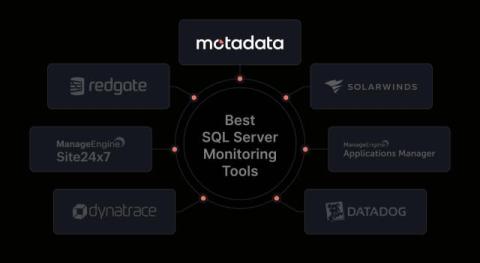
A slow query can affect an application before the database team knows what is causing it. A blocked session, failed job, or growing database file can create more problems if no one spots it early. That’s where SQL Server monitoring tools come in. They help you track database performance, find slow queries, monitor waits and locks, and see what changed before a problem occurred.

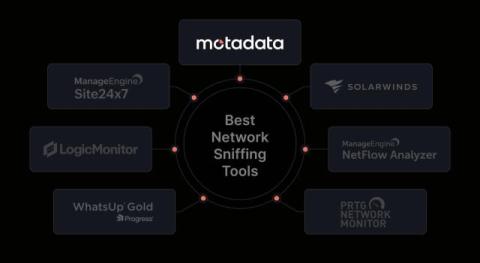
7 Best Network Sniffing Tools for 2026

Ever wondered what is actually using your network when it suddenly slows down? It could be a device sending too much data, a backup running at the wrong time, or an application taking too long to respond. Without visibility into network traffic, finding the real cause can take hours. That’s where network sniffing tools can help. They let you inspect network traffic, capture packets, and see what is happening between devices, servers, and applications.

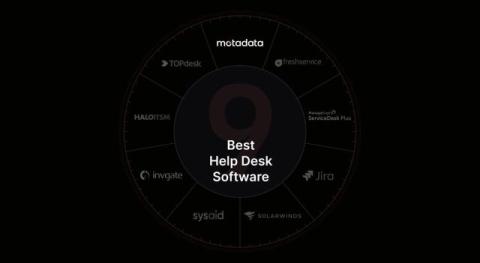
9 Best Help Desk Software for Small Business in 2026

Why is your network slow or failing even when your devices seem to be working? Finding the cause of a network problem can take time. You may need to check packet loss, trace the network path, find a busy link, or see why an application is not connecting. A simple ping test can tell you whether a device responds, but it cannot always show what is causing the problem. Network diagnostic tools help you narrow down the cause by checking devices, ports, routes, packets, traffic, and link performance.

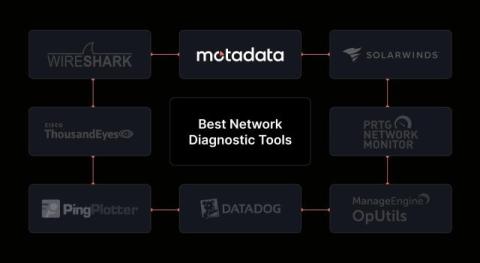
8 Best Network Diagnostic Tools for 2026

If your team manages a network across several offices and cloud systems, finding the cause of a slow or failed connection can take time. You may run into problems such as: As your network grows, a quick test from one computer may not show where the problem started or when it first appeared. Network diagnostic tools help you check devices, ports, routes, packets, and link performance.

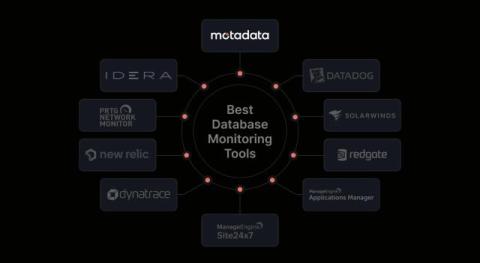
10 Best Database Monitoring Tools for 2026

If your company relies on multiple databases and applications, keeping track of database performance can become difficult. You may face challenges such as: As your database environment grows, identifying the cause of performance issues becomes harder without the right monitoring in place. I get why database monitoring tools have become an important part of managing database performance. They help you monitor database activity, spot performance issues, and find what is causing a slowdown.

Remote Infrastructure Management: How to Run Sites With No IT Staff

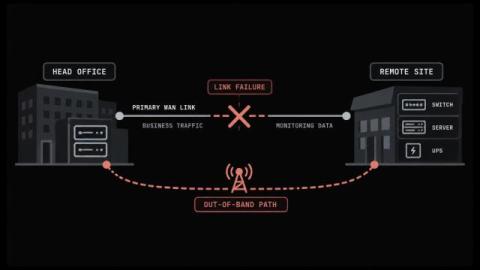
Most IT teams now look after more sites than they have people to visit. Remote infrastructure management covers that gap, and it works differently from the IT infrastructure management you run inside a building where somebody can walk over and look at whatever broke. The technology rarely causes the trouble. Trouble starts when a site goes quiet and there's nobody standing there to look at it.

ISO 27001 Compliance: What Auditors Require and When You Need the Certificate

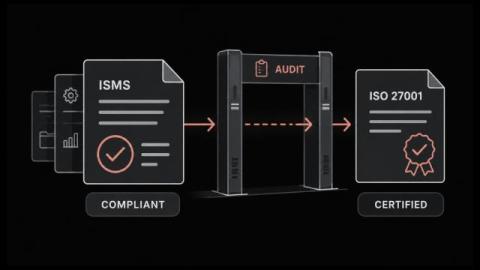
ISO 27001 compliance means running your information security the way ISO/IEC 27001 sets out. Most teams meet the standard when a customer sends over a security questionnaire. It lands as one more line on a cybersecurity compliance checklist. That framing hides the decision underneath it. You can follow the standard without ever being certified against it. The two routes cost very different amounts. In this blog, you will: You will finish able to decide whether you need the certificate, and what it takes.

10 Best AI Help Desk Software for 2026

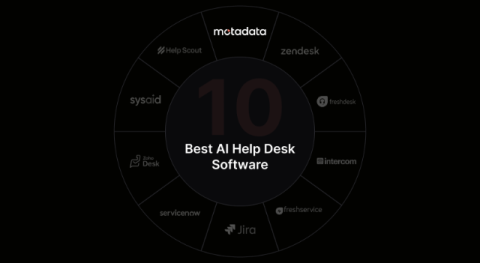
Are your support teams spending too much time handling tickets and answering repetitive questions? As support requests increase, teams spend more time reading conversations, assigning tickets, finding relevant information, and preparing replies. These tasks can take attention away from complex issues that require human support. AI help desk software can help reduce this workload. It can answer common questions, summarize tickets, suggest replies, route requests, and assist with support tasks.

SOX ITGC Controls Checklist for IT Service Management and Year-Round Audit Readiness

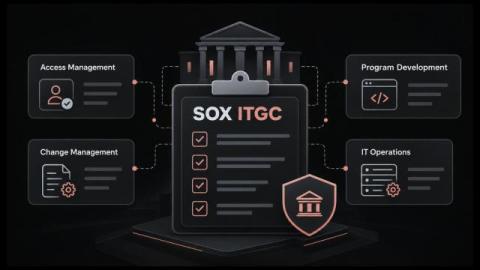
How much of your SOX audit season goes into rebuilding proof of work that was already done? Access was approved, the change went through review, the backup ran, yet the evidence lives in email threads, chat messages and a spreadsheet someone updated last quarter. When an auditor asks for a complete list of production changes, IT staff have to pull records from several places against a deadline.

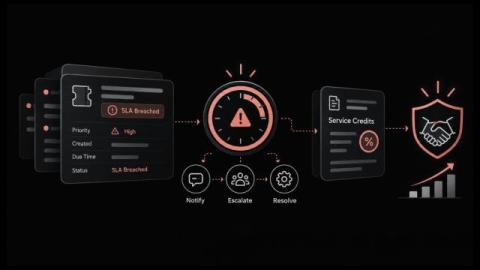
What Happens When an SLA is Breached and How to Recover Customer Trust

What does your organization owe a customer when a priority ticket misses its resolution target by forty minutes? For most service providers and internal service desks, the answer stays unclear until the customer asks for a credit or a manager asks why the monthly SLA report shows a miss. By then, the facts that decide the outcome, such as when the clock started, whether it paused and who was told, are scattered across tickets, emails and chat threads.