Dashboards

Centralized Alert History in Grafana; GA in 11.2 | Grafana

With the centralized alert history page, you can view a history of all alert events generated by your Grafana-managed alert rules from one centralized page. This helps you see patterns in your alerts over time, observe trends, make predictions, and even debug alerts that might be firing too often. Grafana Cloud is the easiest way to get started with Grafana dashboards, metrics, logs, and traces.

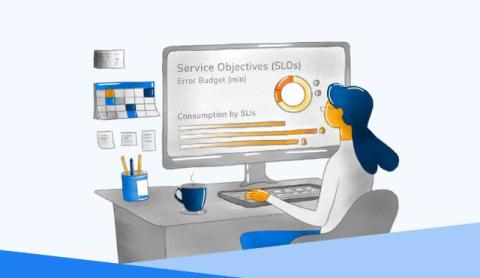
Creating Effective SLO Dashboards: A Comprehensive Guide

In modern software engineering, the concept of Service Level Objectives (SLOs) has become a cornerstone of reliable service delivery. SLOs define the acceptable level of service that a system must deliver, serving as a benchmark for both internal teams and external users. However, setting SLOs is only half the battle; effectively tracking and managing these objectives is crucial to ensure that services remain within the desired thresholds. This is where SLO dashboards come into play.

How to Easily Configure Your ITSM Dashboards

A service desk dashboard is your de facto control center for everything related to Service Management. It should be clear, detailed, versatile, and offer a single-glance way to get the necessary information. Otherwise, you risk mismanaging your IT assets and operations because you missed valuable data points. You need your ITSM dashboard to: See how you can fully customize your ITSM dashboard on InvGate Service Desk and start measuring your service desk KPIs quickly!

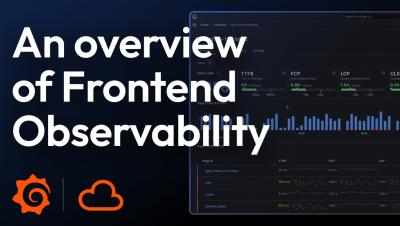
Gain actionable insights with real user monitoring: the latest features in Grafana Cloud Frontend Observability

One of the biggest challenges observability teams face today is gaining end-to-end visibility into their cloud native apps, including modern browser frontends. Without that visibility, you potentially open the door to bad end-user experiences that can hurt customer satisfaction, reduce search engine discoverability, and interfere with overall business goals. This is the exact challenge we address with Grafana Cloud Frontend Observability.

Multi-cloud monitoring made easy: monitor AWS, Microsoft Azure, and Google Cloud services all in one app

Managing multi-cloud environments often means juggling different monitoring tools for each provider, leading to increased complexity and operational overhead. To solve for that, we’re excited to introduce Cloud Provider Observability — an application for monitoring AWS, Microsoft Azure, and Google Cloud services, all in Grafana Cloud.

How to aggregate metrics but retain critical data: Introducing Exemptions in Adaptive Metrics

When you hear about Adaptive Metrics in Grafana Cloud, all signs point to how it’s a game changer. Adaptive Metrics, which aggregates unused and partially used metrics into lower cardinality versions, has delivered a 35% reduction in metrics costs on average for more than 1,200 organizations. Companies have also spoken candidly about the cost savings they gained from the feature.

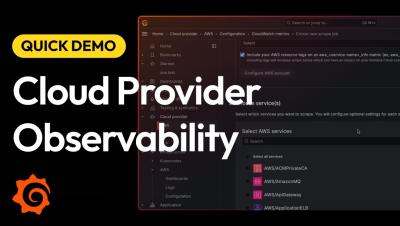
Introducing Cloud Provider Observability in Grafana Cloud | Demo | Grafana Labs

Learn how multi-cloud monitoring just got easier with Cloud Provider Observability in Grafana Cloud. In this video, you'll get glimpse at how the new app can enhance your observability strategy for all your major cloud providers. Plus you'll get a quick walk-through of the app.

How to Reduce Metrics Costs with Grafana Cloud Adaptive Metrics | Grafana Labs

Grafana Cloud Adaptive Metrics has helped users save up to 70% on observability costs by automatically aggregating unused and partially used metrics. This video features a demo on Adaptive Metrics, where you’ll learn what we mean by “adaptive” — automating the process of recommending which metrics to drop while giving you the flexibility to determine any exemptions. This boils down to maintaining effective observability while reducing costs.

Identifying VMware underutilization using SquaredUp dashboards

Recently I've been working with an MSP on a couple of their use cases. One of the services they're designing for their customers is that of cost optimization on their IT infrastructure. On top of the in-house services and tools they had, they needed a tool to help them identify and quantify this underutilization. This is something SquaredUp is very well suited to do – and so we got to work!