Dashboards
Even More Blazin' Fast PromQL
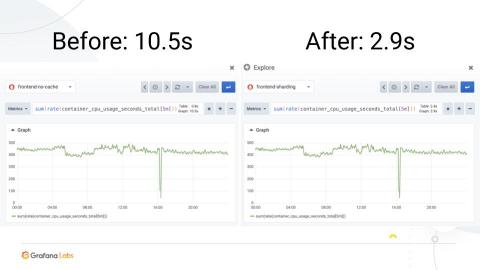
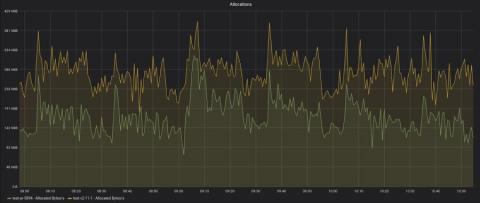
At KubeCon San Diego, I presented an updated and revised version of my talk “Blazin’ Fast PromQL”. In this blog post I’ll give you a brief write up of the talk and steps to reproduce the results yourself.
Pro Tips: Dashboard Navigation Using Links
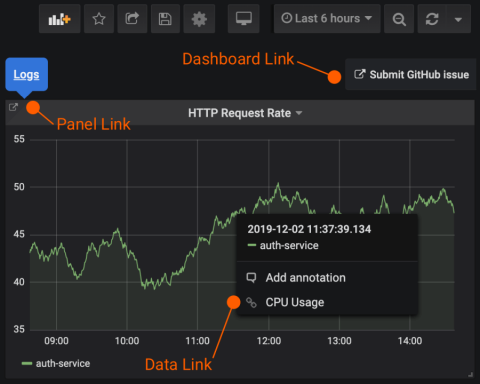
Great dashboards answer a limited set of related questions. If you try to answer too many questions in a single dashboard, it can become overly complex. As a consequence, a single dashboard often can’t tell the whole story. So you end up navigating between several, and it can be quite inefficient to search for a particular dashboard every time you need it. Luckily, there are some hacks for navigating between dashboards.
Introducing Infrastructure Monitoring
How to Do Automatic Annotations with Grafana and Loki
Grafana annotations are great! They clearly mark the occurrence of an event to help operators and devs correlate events with metrics. You may not be aware of this, but Grafana can automatically annotate graphs by querying Loki. Here’s a look at how to use this feature. Loki queries can be used to automatically generate annotations on Grafana dashboards since 6.4.0. For every log line that is returned from a query, the text is automatically displayed as an annotation at the appropriate time.
Top 10 Web Applications for Data Visualization
Data visualization is an essential concept in the field of data science. So much so that whenever you want to analyze any set of data, you must always incorporate data visualization. Regardless, the majority of people still do not have a proper understanding of this concept and how to implement it. Therefore, in this article, we define data visualization and examine ten website applications for performing it.
[PromCon Recap] A Look at TSDB, One Year In
This is a writeup of the talk I gave at PromCon 2019. TSDB is the storage engine of Prometheus 2.x. Based on the Gorilla compression, it started out in an independent repo, which eventually attracted 60+ contributors and 771 stars. There were 500+ commits after the Prometheus 2.0 release. The repo was archived in August 2019, and now it’s a part of the Prometheus repo, inside the tsdb directory. Here are some highlights of the development over the past year.
How to Explore Prometheus with Easy 'Hello World' Projects
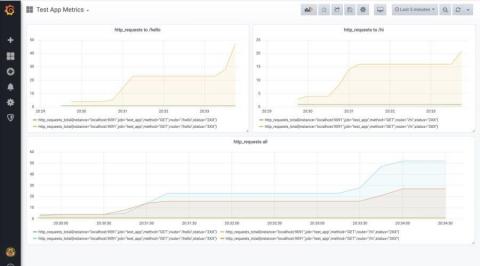
In this blog post, I would like to share with you some of the projects that I used to to get a better sense of what Prometheus can do. I am a very hands-on type of learner, and usually when I want to explore new technologies, I start with “hello world” apps and small toy projects. Therefore, the main goal of this blog is to share with you how easily you can set up Prometheus and how quickly you can create simple projects that can be monitored with Prometheus and visualized in Grafana.
[KubeCon Recap] Cloud Native Architecture: Monoliths or Microservices?
Microservices have been gaining popularity since they were introduced in 2015. But they come with challenges for both developers and users because of the intricate configuration and deployment which often leave developers longing for the simplicity of monolithic applications.
[KubeCon Recap] Configuring Cortex for Maximum Performance at Scale
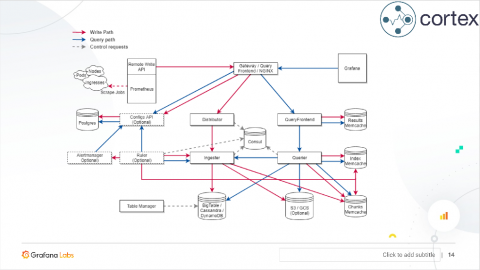
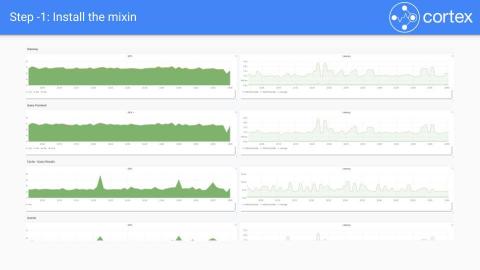
In this KubeCon + CloudNativeCon session last month, Grafana Labs Software Engineer Goutham Veeramachaneni offered a deep dive into how to make sure your Cortex will scale with your usage.

