Smarter IT Operations Through Actionable Insight
Business leaders talk excitedly about "digital transformation" and "innovative customer experience," but it falls on the shoulders of IT operations to make sure everything actually works. As transformation takes hold, IT teams manage increasingly complex, hybrid, and distributed environments – often comprising traditional on-premises systems and modern infrastructures made up of containers, multiple clouds, and virtualized networks.
Publish SIGNL4 oncall and alert information to your Grafana dashboard
Grafana is as open source analytics and interactive visualization application. You can connect different data sources to display chart and graphs or even trigger alerts. Wouldn’t it be great to add information about SIGNL4 alerts or about who is on call as part of your dashboard? In this case you immediately get an overview about open, acknowledged, and closed alerts per category. Of you can see wo it currently on duty. Here is an example with a who-is-on call, and an alert overview panel.
ObservabilityCON 2021: Your guide to the newest announcements from Grafana Labs
This morning during the ObservabilityCON keynote, we announced some of the exciting projects and feature enhancements we’ve been working on for our customers and community. And it doesn’t end there. Throughout the week, we’ll continue to unveil new features, go deeper with live demos, and share our plans to shape the future of observability. With so many new announcements and features to check out, we want to make sure you know where to get more details about these developments.
The 18 most popular data source plugins for Grafana in 2021
As a composable solution, Grafana allows you to bring your data into dashboards natively without having to extract it, load it, or transform it. We believe in a “big tent” philosophy, which allows you to choose the tools that best suit your observability strategy, and with our plugins, Grafana is interoperable with more than 100 data sources.
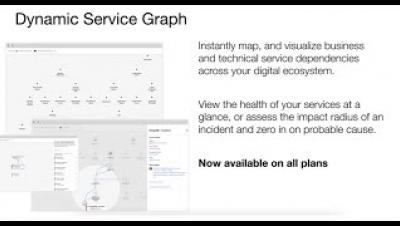
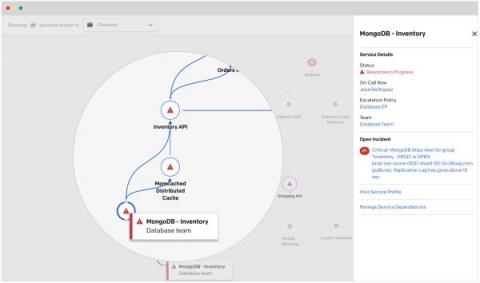
Make sense of complex systems with Dynamic Service Graph by PagerDuty
Visualize and manage all of your services in one place with Dynamic Service Graph
In this digital era, technology systems are becoming increasingly complex. No longer can a single SME (subject matter expert) understand every facet of the system they run. Instead, much of this knowledge is siloed and exists as tribal knowledge within certain teams. Additionally, the rate of change is faster than ever, with code deploying and new services shipping at a rate unimaginable a few years ago.
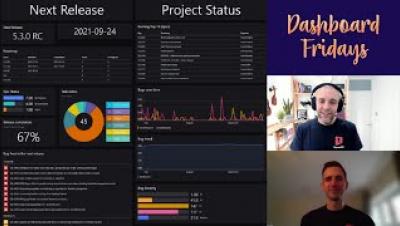
Dashboard Fridays: Sample JIRA Health dashboard
How sparse histograms can improve efficiency, precision, and mergeability in Prometheus TSDB
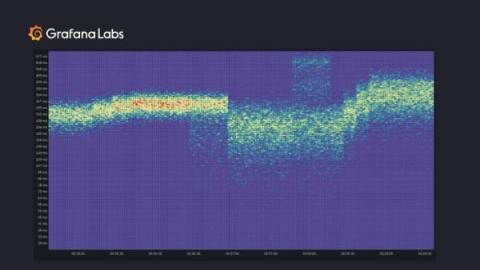
Grafana Labs recently hosted its first company-wide hackathon, and we joined forces with Björn “Beorn” Rabenstein to bring sparse high-resolution histograms in Prometheus TSDB into a working prototype. The Prometheus TSDB has gained experimental support to store and retrieve these new sparse high-resolution histograms. At PromCon 2021, we presented our exciting, fresh-off-the-presses results from the ongoing project.
Introducing new integrations to make it easier to monitor Vault with Grafana
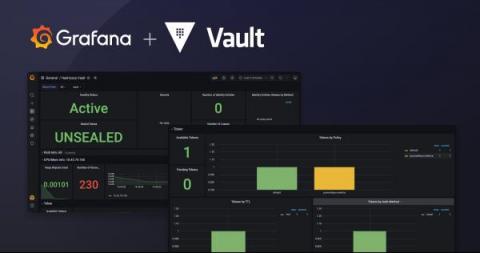
HashiCorp Vault is an increasingly popular multi-cloud security tool that allows users to authenticate and access different clouds, systems, and endpoints, and centrally store, access, and deploy secrets. At Grafana Labs, we’re always looking for ways to make it easy for our community to get started monitoring important parts of their systems. So we’re happy to share some new integrations that will help our users get the most out of Grafana + Vault.


