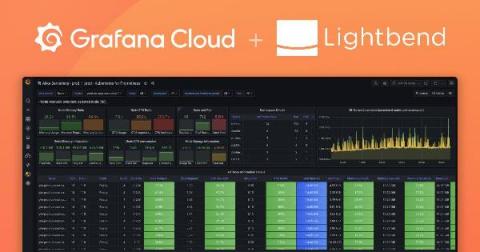
How Lightbend uses Grafana Cloud to monitor a platform-as-a-service launch
When top companies have needed platforms for their demanding, globally distributed, cloud native application environments and streaming data pipelines, they’ve turned to Akka, the most popular implementation of the Actor Model for cloud native applications running on Kubernetes. The company behind Akka is Lightbend, a leader in the world of cloud native applications and architectures.
The U.S. Department of Defense formally authorizes Grafana, Grafana Enterprise, and Loki for its 100,000 developers
Not so long ago, development teams working for the U.S. Department of Defense could take anywhere from three to ten years to deliver software. “It was mostly teams using waterfall, no minimum viable product, no incremental delivery, and no feedback loop from end users,” Nicolas M. Chaillan, Chief Software Officer of the U.S. Air Force, said in a CNCF case study. “Particularly when it comes to AI, machine learning, and cybersecurity, everyone realized we have to move faster.”
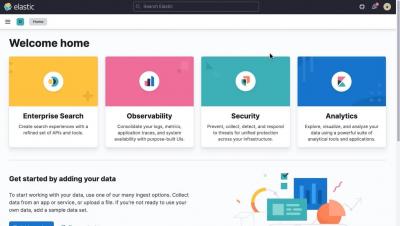
Getting to know Kibana
With the Salesforce plugin for Grafana, easily visualize your SFDC data and correlate it with other data sources
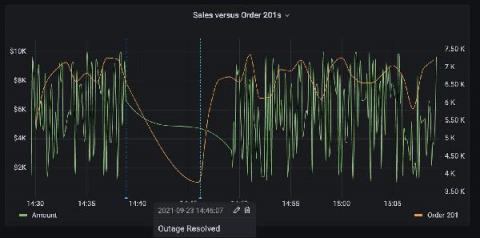
Good news for Salesforce users: With the new Salesforce plugin for Grafana, available now with an Enterprise license, you can instantly visualize your SFDC data in Grafana dashboards. Plus, Grafana allows you to visualize the Salesforce data alongside all sorts of other data. One interesting use case is correlating sales data to system metrics and logs, which would be valuable if your company uses any software systems at all to help generate revenue.
Logit.io Announces The Beta Launch Of Hosted Grafana
We are pleased to announce the beta launch of hosted Grafana in addition to our existing ELK as a Service & hosted Open Distro services. As organisations around the world are constantly looking for ways that they can ensure compliance is being upheld, speeding up Mean Time To Repair (MTTR) and reducing the risk of DDoS attacks, managed Grafana forms a vital role in improving metrics observability across the entirety of your infrastructure.
Introducing Pre-Installed Logz.io Metrics Dashboard Bundles
We are proud to announce the launch of direct dashboard uploads with Logz.io. These new metrics dashboard templates are available for 25 different tools and more to come. Each of these templates is now available to Logz.io customers and covers the gamut of popular monitoring tools used by DevOps teams. Some of these tools also include multiple options. The process is simple. Head into the Logz.io app and head to your metrics account.
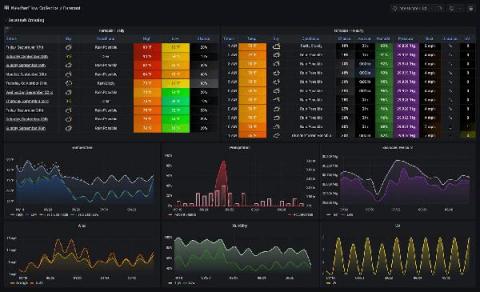
How to visualize real-time data from an IoT smart home weather station with Grafana dashboards
One of the experiences I’ve truly enjoyed over my first year as a senior solutions engineer here at Grafana Labs has been learning from our community and customers about their own Grafana journeys. I’ve been impressed by some remarkable dashboards for home automation, personal health data visualizations, family Minecraft statistics, and energy usage projects.
Kubernetes application dashboard
Giving developers a portal they can use to understand application dependencies, ownership, and more has never been more critical. As you scale your Kubernetes adoption, you want to make sure you avoid service sprawl, and if not done early, application support will become a nightmare.
What Are the Limitations of Dashboards?
For modern businesses faced with increasing volumes and complexity of data, it’s no longer efficient or feasible to rely on analyzing data in BI dashboards. Traditional dashboards are great at providing business leaders with insights into what’s happened in the past, but what if they need actionable information in real time? What if they want to use their data to estimate what may happen in the future? Companies are taking notice.

