Dashboards

How to monitor Lambda with CloudWatch Metrics

With AWS Lambda, you have basic observability built into the platform with CloudWatch. CloudWatch offers support for both metrics and logging. CloudWatch Metrics gives you basic metrics, visualization and alerting while CloudWatch Logs captures everything that is written to stdout and stderr. In this post, we will take a deep dive into CloudWatch Metrics to see how you can use it to monitor your Lambda functions and its limitations.

Pro Tips: How Amgen Manages On Calls (and Burnout) with Grafana

There is a lot of talk about graphing all the things, but have you ever considered graphing all the people – in particular their on calls – as well? “Not letting people burnout on call is something that is being talked about in the industry,” said Jordan J. Hamel, Design Engineer at the biotech company Amgen.

Community Spotlight: BigQuery Plugin

The Grafana community comes up with some pretty cool stuff, and we’re hoping to spotlight some of it from time to time. Today, we’re starting with the BigQuery datasource plugin developed by the team at DoiT International. DoiT is a reseller of Google Cloud and AWS that helps companies either move from on premise to cloud or move from one cloud provider to another.

A Look Inside GitLab's Public Dashboards

There are transparent companies – and then there’s GitLab. “GitLab is a ridiculously transparent company,” said Ben Kochie, a Staff Backend Engineer for Monitoring at GitLab. “When GitLab has a database outage, we live stream the recovery on YouTube.” GitLab has the same bare all approach to its metrics. “All of our Prometheus metrics are available on a public Grafana dashboard,” Kochie told the crowd gathered at GrafanaCon.

Grafana Tutorial: Simple Synthetic Monitoring for Applications

Often there’s a focus on how a service is running from the perspective of the organization. But what does service health monitoring look like from the perspective of a user? There are many metrics that indicate the overall health of a container, vm, or application, but independently they do not indicate if the system is functioning correctly. Often these metrics (CPU, disk, memory) are too narrow, and they can be poor indicators. High CPU may be desirable or bursts of memory usage may be normal.

How Grafana Labs is Democratizing Metrics Now

Metrics for all – and all for metrics. At Grafana, we not only strive to give people a “single pane of glass” to unify observability metrics. From the very start, our mission has been to advocate for the democratization of metrics, which is the idea that the paradigm needs to shift between who can store data, why they need to store it, and, ultimately, what they’re able to with it. And Grafana users are a great example of how vast and varied the needs are for data access.

An Open Technology Stack for Industrial IoT

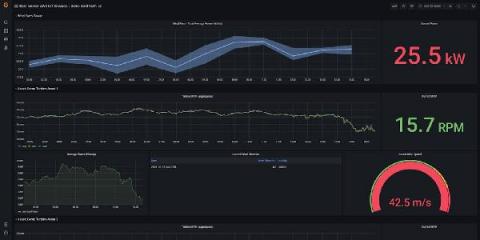
AMMP Technologies runs monitoring for energy systems, usually off mini-grids in Africa. The company uses Grafana to monitor interface with physical objects that are not servers or containers. “It’s interesting how a toolkit for visualizing essentially internet/computer/server metrics is so well-suited to working with real-life streaming data,” AMMP Cofounder Svet Bajlekov said during his talk at GrafanaCon L.A.

Viewing LogicMonitor Reports Within Dashboards

As a Sales Engineer, I hear interesting product requests on a daily basis, and integrating LogicMonitor reports with LogicMonitor dashboards comes up frequently. LogicMonitor's reporting engine has many useful functions from capacity planning to SLA calculation, and dashboards help users visually digest the raw data of reports.

Creating Custom Kibana Visualizations

As you may very well know, Kibana currently has almost 20 different visualization types to choose from. This gives you a wide array of options to slice and dice your logs and metrics, and yet there are some cases where you might want to go beyond what is provided in these different visualizations and develop your own kind of visualization.