Dashboards

Logz.io Enhancements and Changes with Kibana 7

We are happy to inform you that we are upgrading our user interface to support Kibana 7 for Logz.io! Kibana 7 offers users a long list of UI and UX enhancements that will make monitoring and troubleshooting your environment a much simpler and nicer experience. These enhancements include a cross-app dark theme, a new time picker, new filtering, a better dashboarding experience, and most importantly – a significant boost in performance. Shall we take a closer look?

Grafana Templates for Elasticsearch, Prometheus and InfluxDB

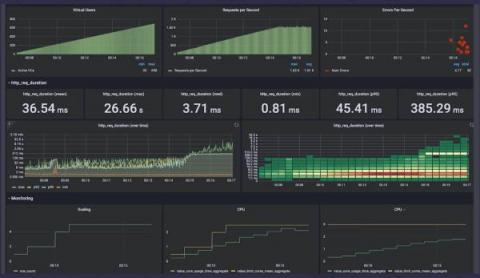
Grafana is everywhere. Almost every DevOps team out there is currently in the process of creating a proof of concept enabling them to implement Grafana into their stack—if they have not already implemented it, that is. Teams are eager to employ Grafana’s highly effective visualizations and dashboards that monitor and track services’ functionality and performance.

Announcing the General Availability of LogDNA Screens

LogDNA is known and loved by developers for our lightning fast live tail and search. With some users ingesting over a petabyte of data per day, our users want to be able to visualize their data and put it to use. You told us what analytics you value most and we’ve taken the first step to providing them within the LogDNA product. The first is having highly interactive graphs. Graphs allow you to analyze patterns and trends by navigating through your data over a period of time.

KubeCon Demo: A Preview of Grafana & Jaeger

At the Grafana Labs booth at KubeCon + CloudNativeCon in San Diego this week, we showed a demo of a future feature for Grafana: distributed tracing datasources. Until now, Grafana has been bringing together metrics and logs, to be viewed side-by-side on one screen. Now we’re adding tracing, which has been a missing puzzle piece for even more observability in Grafana.

[PromCon Recap] Two Households, Both Alike in Dignity: Cortex and Thanos

This blog post is a writeup of the presentation Bartek Plotka and I gave at PromCon 2019. Cortex is a horizontally scalable, clustered Prometheus implementation aimed at giving users a global view of all their Prometheus metrics in one place, and providing long term storage for those metrics. Thanos is newer project aimed at solving the same challenges. In this blog post, we compare these two projects and see how it is possible to have two completely different approaches to the same problems.

Loki Reaches GA with v1.0.0 Release

Today is an exciting day for Loki, as we have decided it’s time for Loki to graduate out of beta and into a 1.0.0 GA release! It’s been just about a year since we announced Loki at KubeCon + CloudNativeCon North America in Seattle, and in that time over 137 contributors have made more than 1,000 contributions. Here’s a look at where the project is today.